
Fig. 4.
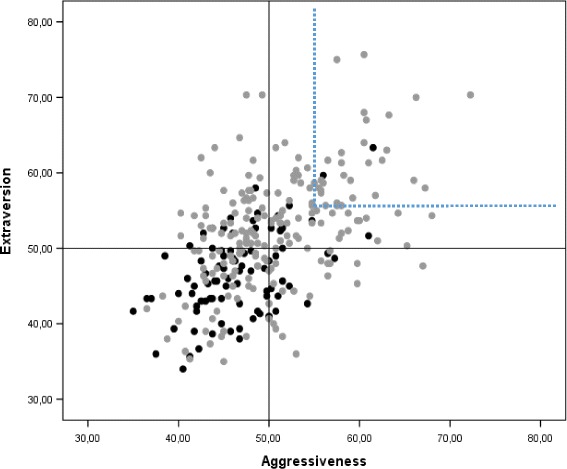
Configurational representation of SSP-derived Disinhibition- and Aggressiveness-related scales (overall mean of all constituent subscales) in patients with bipolar disorder I and II (grey) and healthy controls (black). The upper right quadrant shows patients that combine high scores (>55 T-scores) on both scales (14.9%)