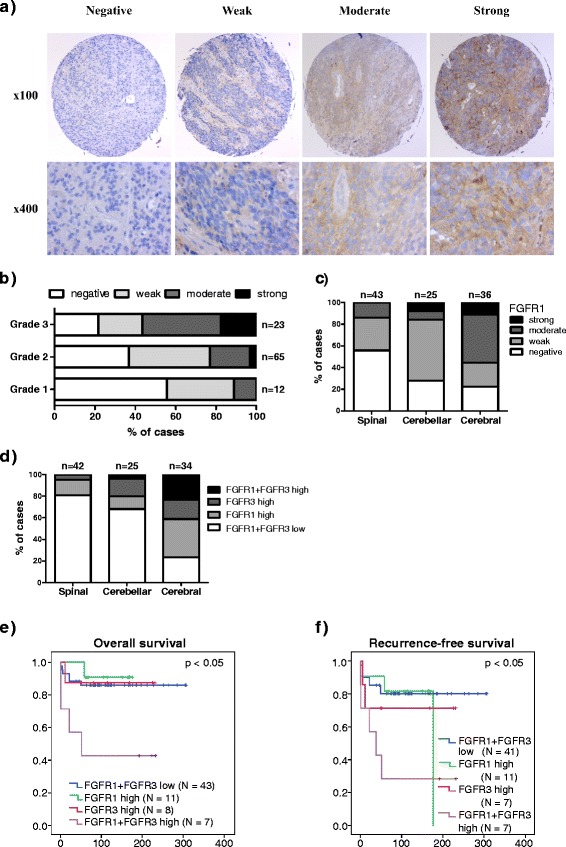
Fig. 2.

Moderate-to-strong FGFR1 and/or FGFR3 expression is characteristic of aggressive ependymomas. a Representative images for FGFR1 staining in ependymomas. b The distribution of FGFR1 immunostaining in grade I-III ependymomas. FGFR1 staining was associated with higher tumor grade (p < 0.05, Fisher’s exact test). c Moderate-to-strong FGFR1 immunostaining was associated with cerebral tumor location (p < 0.01, Fisher’s exact test). Total number of tumors for each location is marked into the figure. d Moderate-to-strong immunostaining of FGFR1 and/or FGFR3 was detected in a majority of cerebral ependymoma samples (p < 0.0001, Fisher’s exact test). e-f). Moderate-to-strong immunostaining of both FGFR3 and FGFR1 was associated with e) poor disease-specific survival (N = 69, p < 0.05, log-rank test) and f worse recurrence-free survival (N = 66, p < 0.05, log-rank test). Newly diagnosed cases were divided into four categories based on the expression of both FGFR1 and FGFR3. High: Moderate-to-strong immunostaining, Low: Negative-to-low immunostaining
