
Fig. 1.
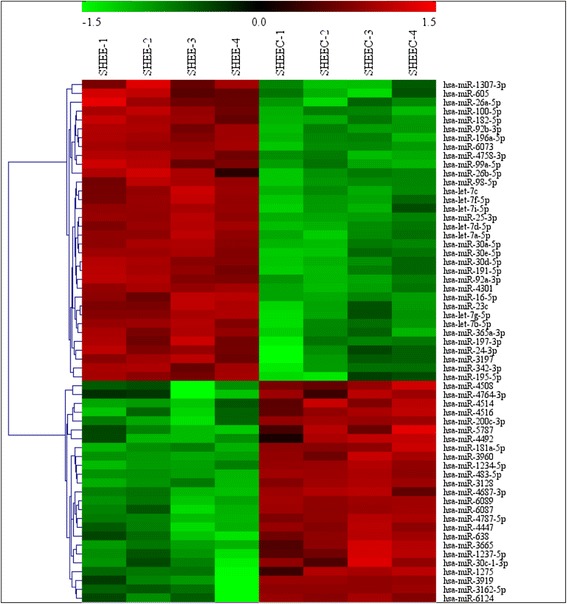
A heatmap of differentially expressed miRNAs depicting miRNAs differentially expressed in the SHEE and SHEEC cell lines with a fold-change >2.0 and p < 0.05
Official websites use .gov
A
.gov website belongs to an official
government organization in the United States.
Secure .gov websites use HTTPS
A lock (
) or https:// means you've safely
connected to the .gov website. Share sensitive
information only on official, secure websites.
A heatmap of differentially expressed miRNAs depicting miRNAs differentially expressed in the SHEE and SHEEC cell lines with a fold-change >2.0 and p < 0.05