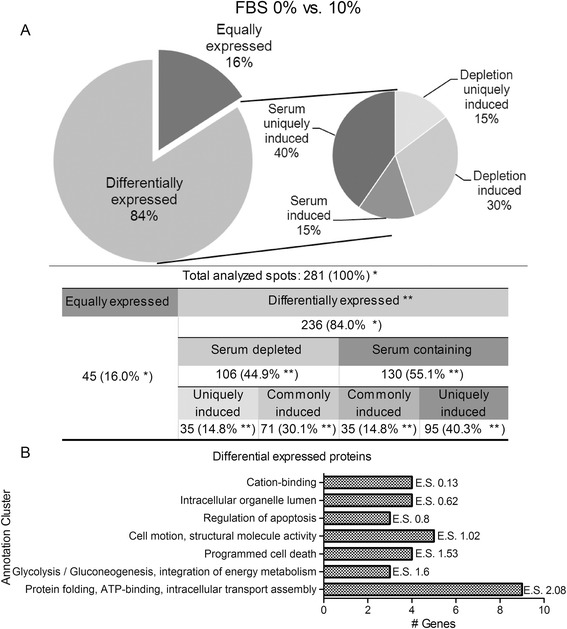
Fig. 4.

Comparative proteomic analysis of proteins expressed by HTR-8/SVneo cells cultured under serum-depleted conditions. a Spot percentage of differentially expressed protein spots in HTR-8/SVneo trophoblast cells cultured in 0 or 10 % FBS for 24 h. n = 3, Kolmogorov-Smirnov test, 0.10, D > 0.642; ANOVA test, p < 0.05. * – percentage of total analyzed spots; ** – percentage of differentially expressed spots. b Enrichment annotation analyses for differential proteins identified. Functional annotation clustering was performed with DAVID. E.S. – enriched score of functional annotation clustering
