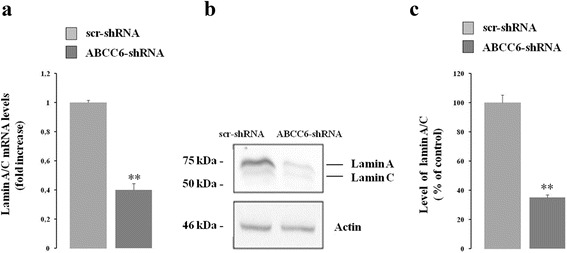
Fig. 4.

Effect of ABCC6 knockdown on lamin A/C gene expression. a – mRNA levels of lamin A/C were quantified for both control (scr-shRNA) and ABCC6 knockdown cells (ABCC6-shRNA) with real-time PCR using β-actin as the internal control. Data are shown as the means ± SD from three independent experiments. b – Representative western blot of lamin A/C in both control and ABCC6 knockdown cells. β-actin was used as a loading control. c – Densitometric analysis of the immunoreactive bands performed in three independent experiments. Data are shown as the means ± SD from three independent experiments. **p < 0.01. Unpaired data were assessed for statistical significance using Student’s t test
