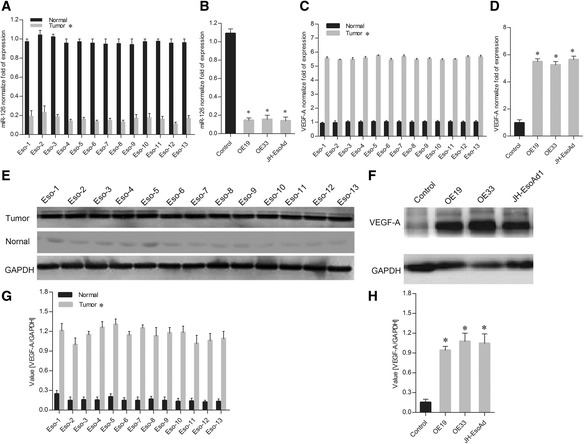
Fig. 1.

Expression of miR-126 and VEGF-A in esophageal cancer tissues and esophageal carcinoma cell lines. a qRT-PCR analysis of miR-126 expression in 13 esophageal cancer tissues and paired adjacent normal tissues. b qRT-PCR analysis of miR-126 expression in three esophageal carcinoma cell lines and a control cell line. c qRT-PCR analysis of VEGF-A expression in the esophageal cancer tissues and paired adjacent normal tissues. d qRT-PCR analysis of VEGF-A expression in three esophageal carcinoma cell lines and a control cell line. e Western blot analysis of VEGF-A expression in esophageal cancer tissues and paired adjacent normal tissues. f Western blot analysis of VEGF-A expression in three esophageal carcinoma cell lines and a control cell line. g Quantitation of protein expression for Fig. 1e. h Quantitation of protein expression for Fig. 1f. The data is shown as the means ± SD. *p <0.01, compared to the control group
