Fig. 2.

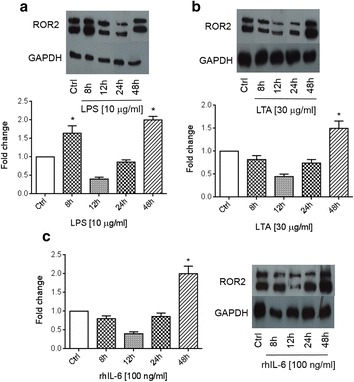
ROR2 expression induced by LPS, LTA and IL-6. Western blot analysis of ROR2 expression in SKOV-3 cells treated with 1 μg/ml LPS (a), 30 μg/ml LTA (b) and 100 ng/ml IL-6 (c) for the indicated times. Normalized values (means ± SD) from three independent western blots for ROR2. The western blots represent one of three independent experiments. GAPDH levels were used as the internal control. *p ≤ 0.05 as compared with the control (Ctrl)
