Fig. 5.

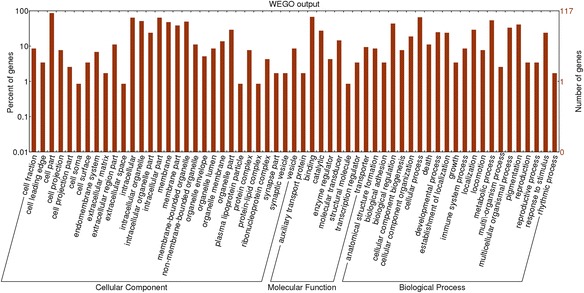
GO analysis based on miRNA-targeted genes. The GOs targeted by abundant miRNAs were shown. The horizontal axis is the GO category and the vertical axis is number of genes

GO analysis based on miRNA-targeted genes. The GOs targeted by abundant miRNAs were shown. The horizontal axis is the GO category and the vertical axis is number of genes