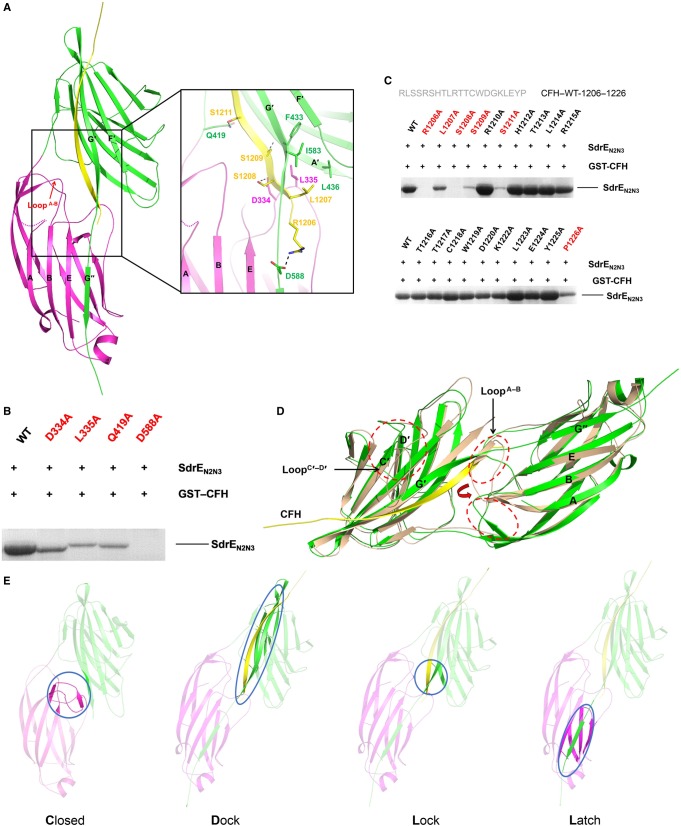
Figure 3. Crystal structure of the SdrEN2N3–CFH1206–1226 complex.
(A) Cartoon representation of the SdrEN2N3–CFH1206–1226 complex. N2 and N3 subdomains from the SdrE and the CFH peptide are coloured purple, green and yellow, respectively. LoopA–B is indicated by a red arrow. Key residues involved in the side-chain interactions between SdrE and CFH are shown as sticks in the zoom-in view. Hydrogen bonds involved in the SdrE–CFH interaction are shown as black dashes. (B) GST pull-down assays of GST–CFH1206–1226 with SdrEN2N3 and its mutants. (C) Identification of the key residues on CFH–CCP20 for SdrE binding. Key residues are coloured red. (D) Structural comparison of apo-SdrEN2N3 (wheat) and the SdrEN2N3–CFH1206–1226 complex (green). LoopA–B and LoopC′–D′ are circled by red dashes and labelled in black. The change of the two conformations of LoopA–B is indicated by a red arrow. (E) A CDLL model for the SdrE–CFH interaction is shown as a cartoon.

