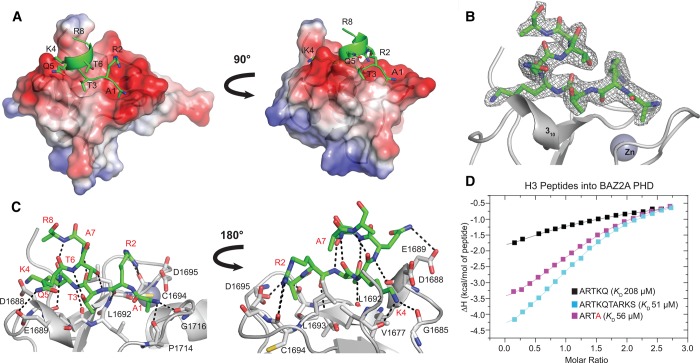
Figure 1. Structural basis of H3 recognition by BAZ2A PHD.
(A–C) Crystal structure of BAZ2A PHD (shown in gray) in complex with H3 10-mer (shown in green). (A) Surface and ribbon representation of BAZ2A PHD (regions of positive and negative electrostatic potential are shown in blue and red, respectively) in complex with H3 10-mer shown in a ribbon and stick representation. Residues of the H3 10-mer peptide are labeled. (B) The 2Fo–Fc map contoured at 1σ (shown in gray) for H3 10-mer. (C) Close-up view of the interaction between the BAZ2A PHD and the H3 10-mer peptide. Residues of BAZ2A PHD interacting with the H3 10-mer peptide are shown in a stick representation and labeled in black. Residues of the H3 10-mer peptide are labeled in red. (D) ITC-binding curves of different H3-derived peptides titrated into BAZ2A PHD.

