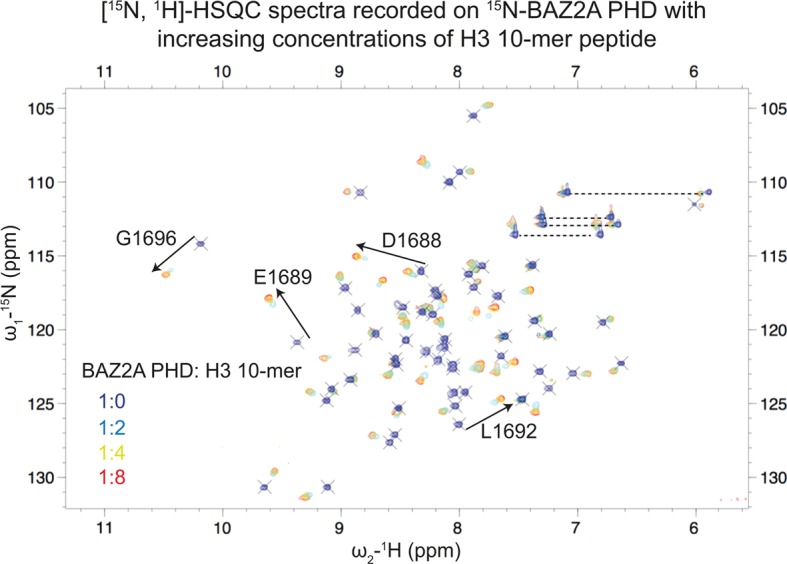
Figure 3. CSPs induced by the H3 10-mer peptide on BAZ2A PHD.

Overlay of [15N-1H]-HSQC spectra recorded on 15N-BAZ2A PHD with increasing concentrations of the H3 10-mer peptide. Spectra were recorded at the following protein:peptide molar ratios: 1:0 (blue), 1:2 (cyan), 1:4 (yellow) and 1:8 (red). For a set of peaks, the direction of the shifts is indicated with black arrows. The horizontal dotted lines indicate peak pairs corresponding to the side-chain of Asn and Gln.
