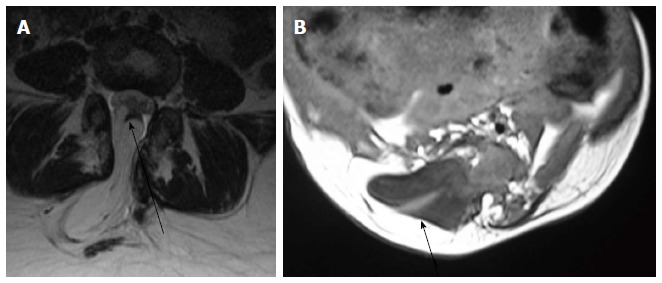
Figure 10.

Lipoma placode interface in lipomyelocele and lipomyelomeningocele. Axial T2 weighted images in cases of lipomyelocele (A) and axial T1 weighted images in case of lipomyelomeningocele (B) showing high intensity fat on the dorsal aspect of the neural placode which is continuous with the adjacent subcutaneous fat. The lipoma placode interface (black arrow) is within the spinal canal in lipomyelocele and outside the spinal canal in lipomyelomeningocele. Both these conditions have intact skin covering.
