Figure 3.
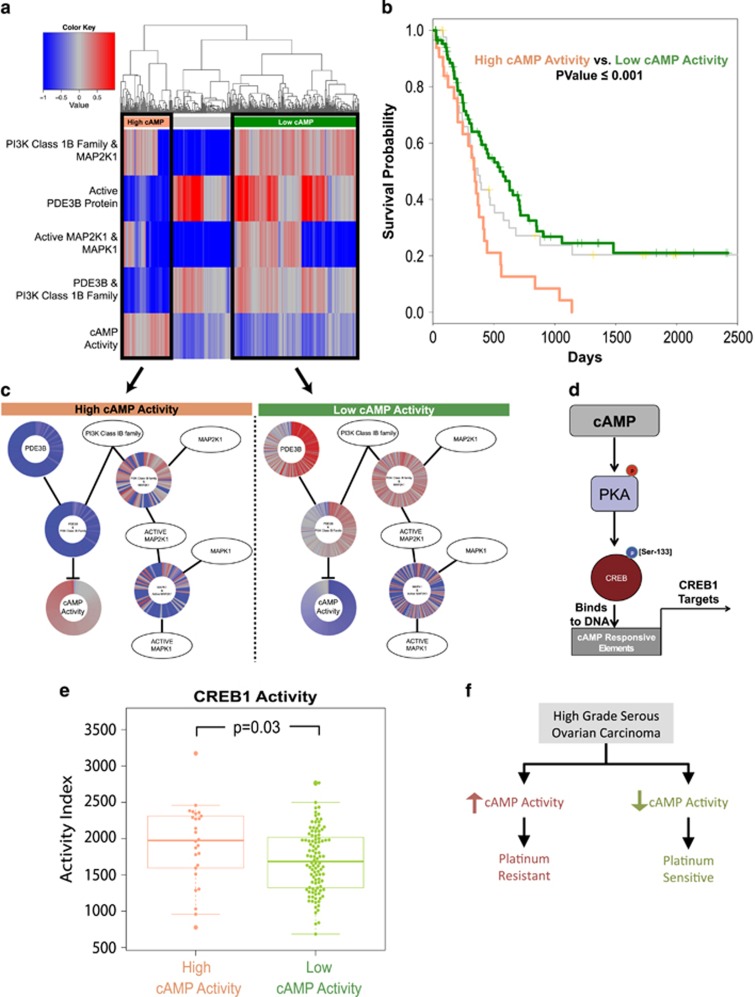
InFlo-based association of the cAMP-PKA-CREB1 axis with progression-free survival in HGSOC. (a) Hierarchical clustering of TCGA HGSOC samples (N=357) using the InFlo-estimated activities of pathway interactions by integrating gene expression and copy-number profiles of genes in the pathway. Rows correspond to InFlo-estimated activity of interactions and columns denote individual tumour samples. The major clusters identified are indicated by pink (High cAMP), grey and green (Low cAMP). (b) Platinum-based progression-free survival of HGSOC patients in each of the clusters. Difference in progression-free survival between High cAMP and Low cAMP clusters (Mantel–Haenszel test P-value⩽0.001), remained statistically significant (significance of multivariable Cox regression coefficient, P-value=0.016) even after controlling for tumour stage, tumour grade, age at diagnosis and extent of residual disease at surgery. (c) Pathway interaction activities across ovarian tumours, organized according to the pathway network structure, are plotted per sample in each of the two major clusters. Each ray in the individual ray graphs denotes the InFlo-estimated activity of the pathway interaction in an individual ovarian tumour sample. (d) The cAMP-PKA-CREB1 signalling axis. (e) CREB1 activity distribution estimated using 34 known transcriptional targets of CREB1 plotted across InFlo-inferred cAMP activity groups. No discernable difference in PI3K Class IB kinase expression was observed between the Low and high cAMP activity groups (Supplementary Figure S5). Low and high cAMP activity groups correspond to samples with InFlo activity scores ⩽−0.25 and ⩾ 0.25, respectively. (f) InFlo-derived model of high cAMP activity as a likely mechanism of platinum resistance in HGSOC.

