Figure 4.
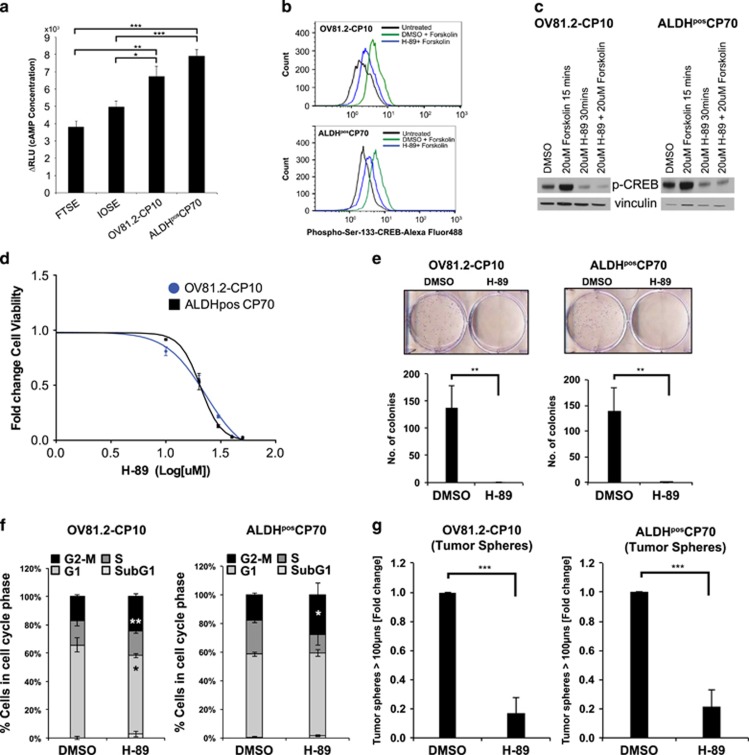
Functional assessment of the role of cAMP axis in HGSOC platinum-resistant models. (a) cAMP assay showing increased cAMP concentrations in OV81.2-CP10 and ALDHpos CP70 cells as compared to non-transformed FTSE and IOSE cells in response to 30 min stimulation by 20 μM forskolin. Values are plotted as differences in relative luciferase units (ΔRLU), which is indicative of cAMP concentration (b) Flow cytometry analysis and (c) western blotting showing H-89 (20 μM-30 min) decreases phosphorylation of CREB1 at ser-133 residue either uninduced or induced in response to forskolin (20 μM-15 min) in both OV81.2-CP10 and ALDHpos CP70 cells. (d) 48-h MTT assay showing H-89 decreases viability in both OV81.2-CP10 and ALDHpos CP70 cells. (e) Clonogenics assay on day 7 showing decreased survival in response to H-89 treatment in these cells. The individual wells treated with H-89 and DMSO control are shown for both OV81.2-CP10 and ALDHposCP70 cells after 7 days of treatment (top row). The bar graphs represent the mean number of colonies in the H-89 treatment versus DMSO control for both cell types (bottom row). (f) 48-h cell cycle analysis by propidium iodide staining shows that H-89 induces G2-M transition arrest in OV81.2-CP10 and ALDHpos CP70 cells. Bar graphs represent the mean percentage of cells in cell cycle phases. (g) 10 × light microscopy and 10 × 10 integrated metamorph software analysis showing decreased tumour sphere formation by day 6 upon H-89 treatment in OV81.2-CP10 and ALDHpos CP70 cells. Bar graphs represent the mean fold-change in number of tumour spheres upon treatment with H-89 as compared to control. (All mean values were estimated over three independent replicates, with the error bars representing standard errors of the mean, with the Student's t-test significance denoted as *P <0.05, **P <0.005, ***P <0.0005).

