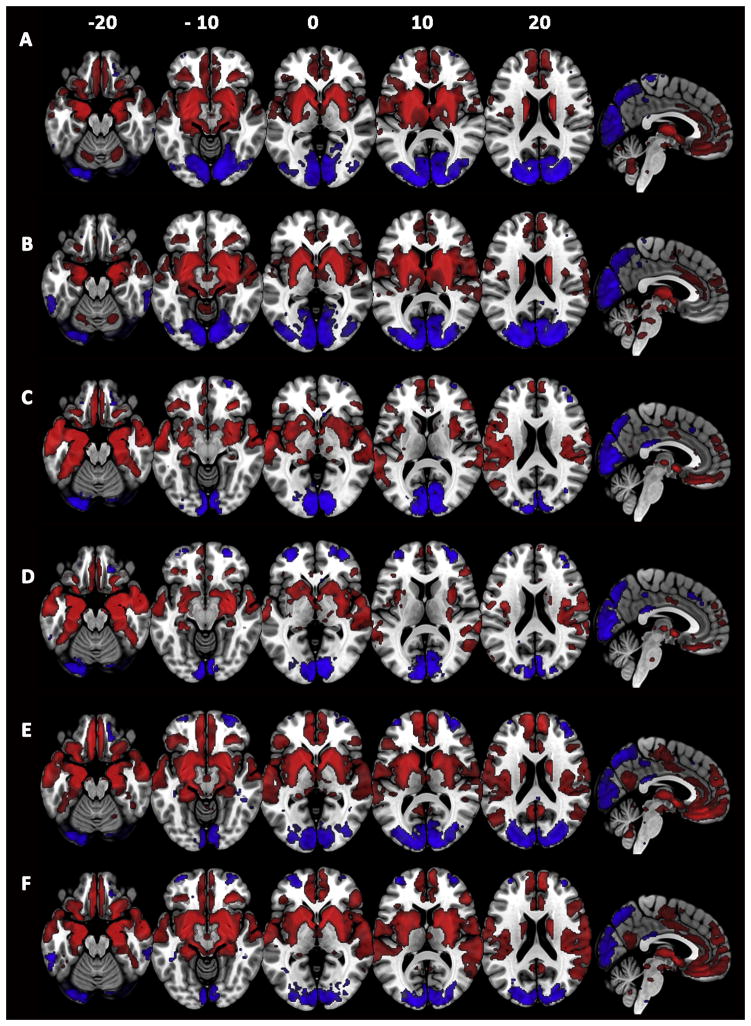
Fig. 3.
Rs-fmri connectivity of each of the centromedial (CM), laterobasal (LB) and superficial (SF) amygdala subregions. Red= regions positively correlated with each amygdala subregion. Blue= regions negatively correlated with each amygdala subregion. A = Left CM, B = Right CM, C = Left LB, D = Right LB, E = Left SF, F = Right SF. To highlight differences in amygdala subregion connectivity, results are shown at voxel-level p<.05 FWE corrected. Data obtained from the NKI/Rockland rs-fmri dataset.

