
Figure 1.
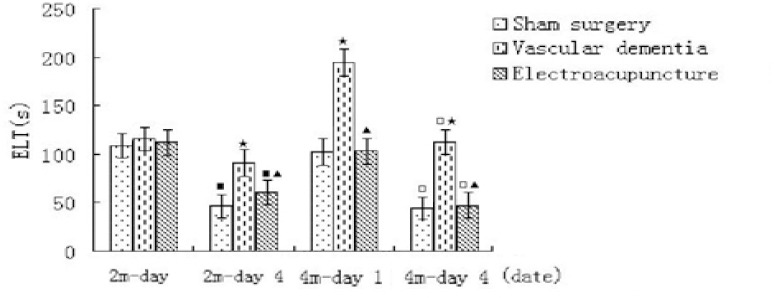
Escape latency time (ELT) on Morris water maze in each group on 2 and 4 month. ■P<0.01, compared with the corresponding group in day 1 ELT on 2 month; □P<0.01, compared with the corresponding group in day 1 ELT on 4 month; ▲ P<0.01, compared with the VD group in day 4 ELT on 2 month, and in day 1ELT and 4 ELT on 4 month respectively.