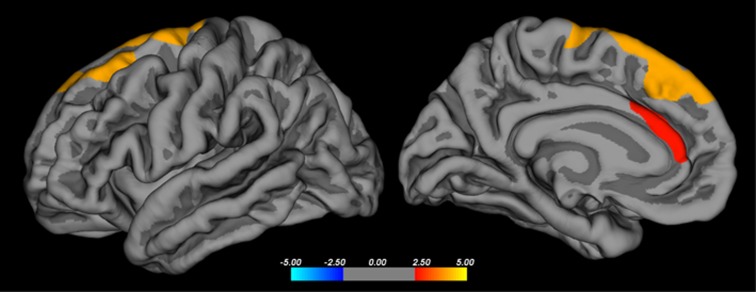
Figure 3.
Brain regions where cortical thickness shows a positive correlation with striatal [11C]Lu AE92686 binding potential in the whole sample (n=26) after controlling for group/scanner. A vertex-wise threshold of PFDR<0.05 and a cluster threshold of P<0.01 was used to correct for multiple comparisons. The clusters cover the left superior frontal gyrus and the anterior cingulate cortex. FDR, false discovery rate.

