Figure 6.
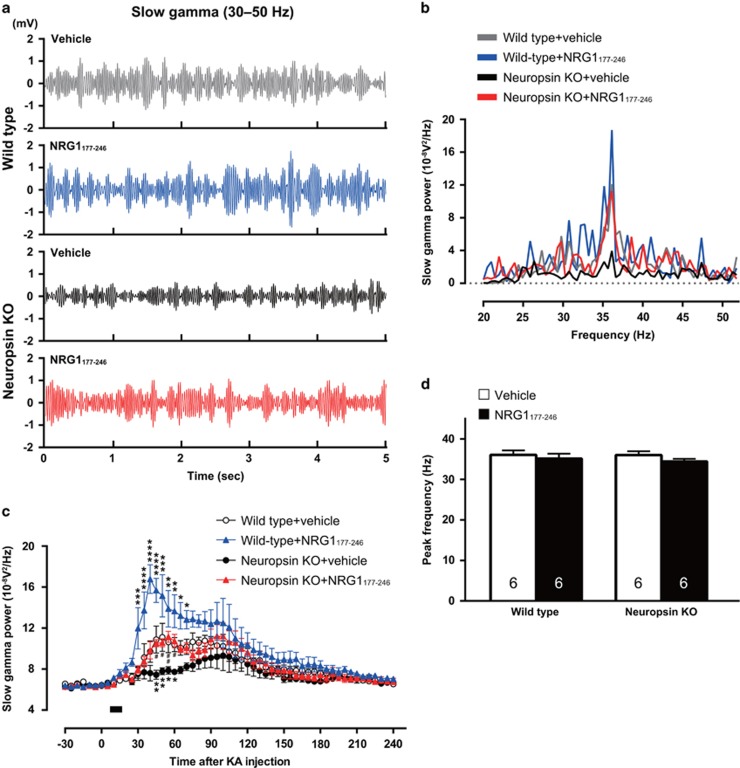
Disrupted slow gamma oscillations in neuropsin-KO mice. (a, b) Representative local field potential traces (30–50 Hz) (a) and power spectra (b) of KA-induced slow gamma oscillations in wild-type mice after vehicle (gray) or NRG1177-246 injection (blue) and in neuropsin-KO mice after vehicle (black) or NRG1177-246 injection (red). (c) Time course for the mean power (and SEM) (30–50 Hz) of KA-induced slow gamma oscillations in wild-type mice after vehicle (white circles; n=6 mice) or NRG1177-246 injection (blue triangles; n=6 mice) and in neuropsin-KO mice after vehicle (black circles; n=6 mice) or NRG1177-246 injection (red triangles; n=6 mice). The power of the slow gamma oscillations in the CA1 region in neuropsin-KO mice was less than that in wild-type mice, but recovered after injection of NRG1177-246 (F(3,20)=6.343, P=0.0034; two-way ANOVA). Significant differences between wild-type and neuropsin-KO mice were observed at 45–60 min after vehicle injection (45 min, **P=0.0044; 50 min, **P=0.0067; 55 min, *P=0.0347; 60 min, *P=0.0459; two-way ANOVA with the Sidak post-hoc test). Significant differences between wild-type mice were seen from 30 to 70 min after injection of vehicle or NRG1177-246 (30 min, ***P=0.0002; 35 min, ****P<0.0001; 40 min, ****P<0.0001; 45 min, ****P<0.0001; 50 min, ***P=0.0005; 55 min, **P=0.0082; 60 min, **P=0.0082; 65 min, *P=0.0117; 70 min, *P=0.0462; two-way ANOVA with the Sidak post-hoc test). There were significant differences between neuropsin-KO mice at 45–60 min post-injection with vehicle or NRG1177-246 (45 min, #P=0.0145; 50 min, #P=0.0329; 55 min, ##P=0.0075; 60 min, #P=0.0183; two-way ANOVA with the Sidak post-hoc test). NRG1177-246 or vehicle was injected during the time period indicated by the bar. (d) Bar graph showing the mean (and SEM) peak frequency of KA-induced slow gamma oscillations in wild-type mice and neuropsin-KO mice after injection of vehicle (white bar) or NRG1177-246 (black bar). No difference in the peak frequency of slow gamma oscillations was detected between the groups (F(3,20)=0.6128, P=0.6146; one-way ANOVA with Tukey's post-hoc test). Numbers inside columns indicate n. KA, kainate; KO, knockout; NRG1, neuregulin 1; SEM, standard error of the mean.

