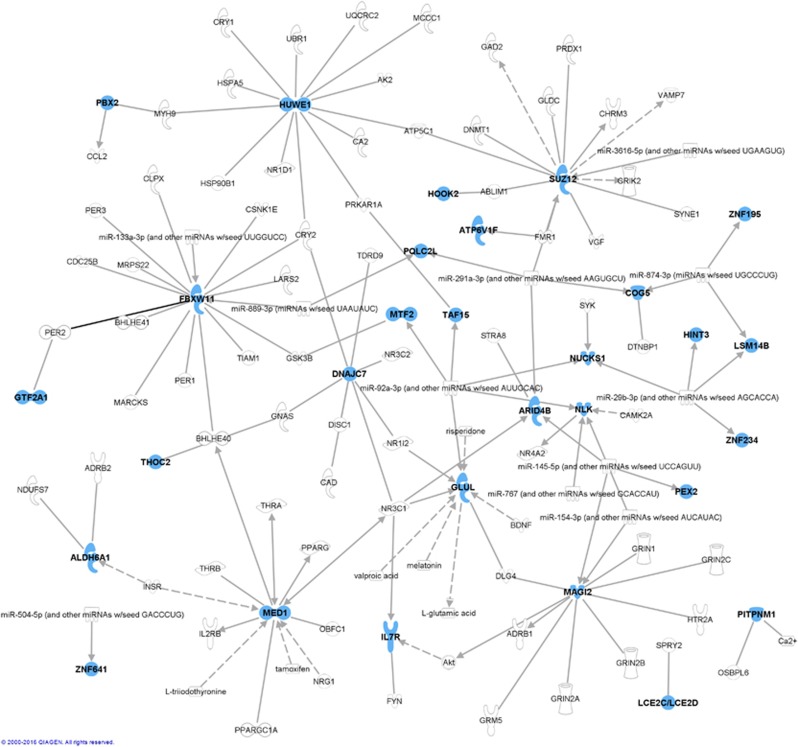
Figure 2.
Connections between ‘risk genes' identified in our analysis and molecules previously reported to be associated with bipolar disorder. Molecules painted in blue are ‘risk genes' identified in our analysis, whereas those in grey are known to have been associated with bipolar disorder (available at IPA Knowledge Base). Relationships are based on expression, protein–protein binding, protein–DNA binding, microRNA targeting, activation or transcription. Dashed lines represent indirect relationships (where the two molecules do not need to physically interact). IPA, Ingenuity Pathway Analysis.

