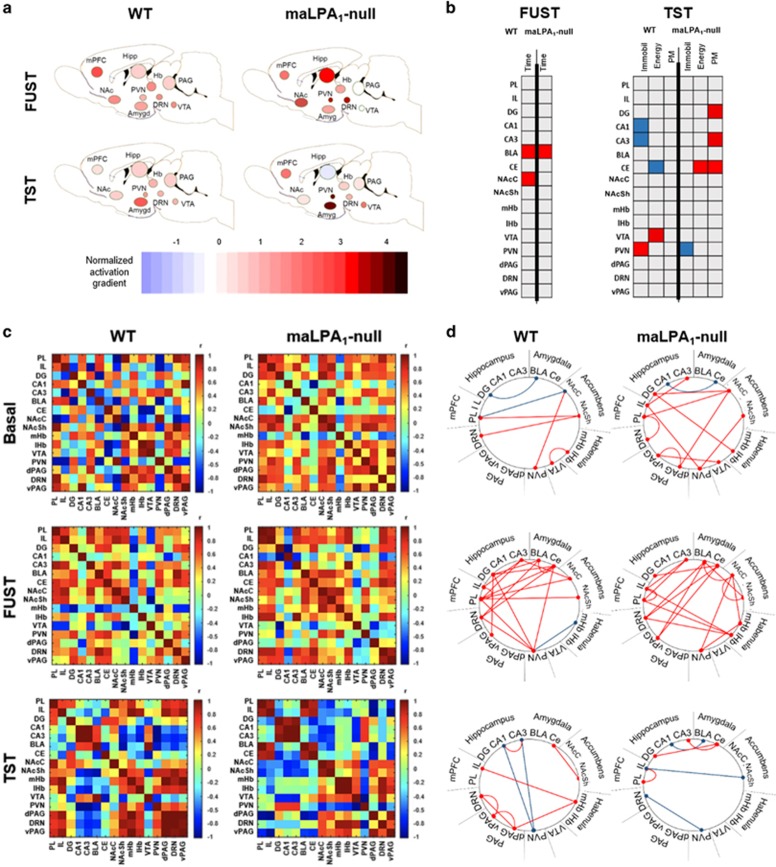
Figure 4.
Functional connectivity in wt and maLPA1-null mice. (a) Activity of the limbic and extralimbic regions involved in mood after behaviour was normalised to the relevant basal group. Structures were grouped into major brain subdivisions. (b) Significant correlations between c-Fos activation and behavioural parameters in the FUST and TST. (c, d) Data are presented for the three conditions: basal (upper), after FUST (middle) and after TST (lower). (c) Interregional correlation matrices reveal different limbic maps in the absence of LPA1 receptor, especially in basal and TST conditions. (d) Strongly correlated levels of c-Fos among structures (r⩾±0.8; P⩽0.05) are shown in the diagrams. Red lines indicate positive correlation, while blue lines illustrate negative correlations. BLA, basolateral amygdala; CA1, cornus ammonis 1; CA3, cornus ammonis 3; CE, central amygdala; d/vPAG, dorsal/ventral periaqueductal grey matter; DG, dentate gyrus; DRN, dorsal raphe nucleus; FUST, female urine sniffing test; IL, infralimbic cortex; lHb, lateral habenula; mHb, medial habenula; mPFC, medial prefrontal cortex; NAc, nucleus accumbens; NAcC, nucleus accumbens core; NAcSh, nucleus accumbens shell; PL, prelimbic cortex; PVN, paraventricular nucleus; TST, tail suspension test; VTA, ventral tegmental area.

