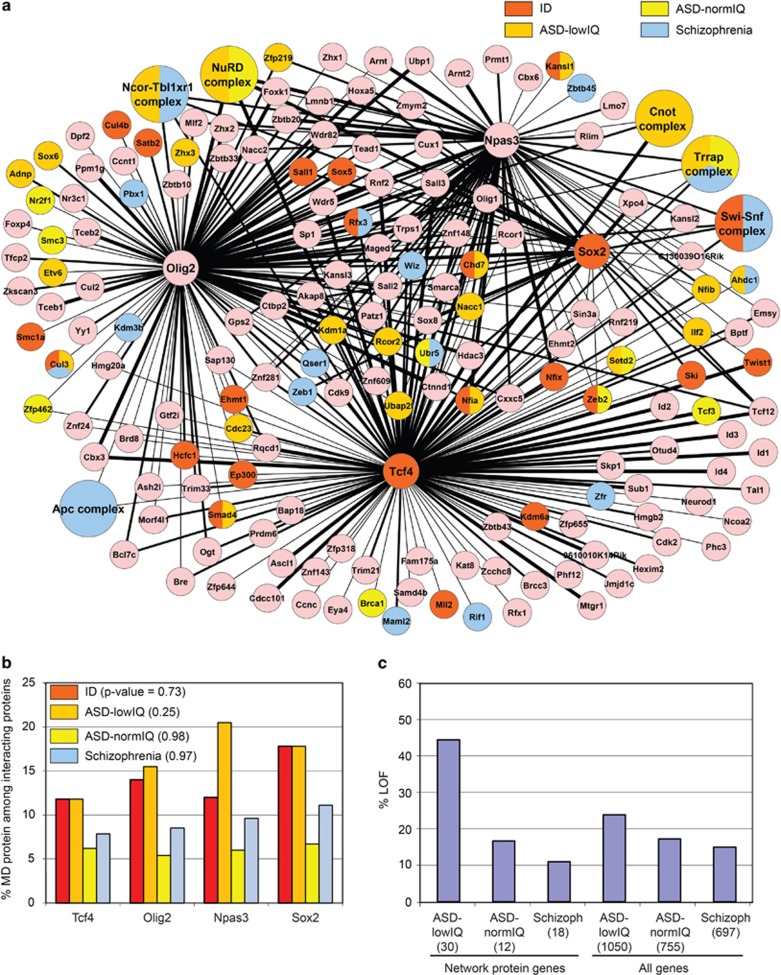
Figure 1.
Protein interaction network in neural stem cells. (a) Interaction network representing proteins present in two or more purifications of FLAG-tagged Tcf4, Olig2, Npas3 or Sox2 from neural stem cells. Protein complexes are larger circles, thickness of the edges (black lines) gives an indication of protein quantity in samples of FLAG-tagged transcription factor with thickest edges; average emPAI ⩾0.6, medium thick edge; average emPAI <0.6 and ⩾0.2, thin edge; average emPAI <0.2. Red color indicates network protein or protein complex subunit(s) encoded by a known ID gene. Orange, yellow and blue color indicate de novo mutation(s) in patients with ASD-lowIQ, ASD-normIQ and schizophrenia, respectively. (b) Percentage MD-associated proteins among interaction partners of Tcf4, Olig2, Npas3 and Sox2. MD-categories ID, ASD-lowIQ, ASD-normIQ and schizophrenia are indicated by red, orange, yellow and blue color, respectively. Fisher's exact tests showed no significant differences between the interactomes of Tcf4, Olig2, Npas3 and Sox2 in the percentages of proteins associated with ID, ASD-lowIQ, ASD-normIQ or schizophrenia, P-values are indicated. (c) Percentage loss-of-function (LOF) mutations in genes mutated in patients with the indicated MD. Network protein genes have the equivalent mouse protein present in the interaction network. Total number of mutations in each category is between brackets. ASD, autism spectrum disorder; ID, intellectual disability; IQ, intelligence quotient; MD, mental disorder.

