Figure 3.
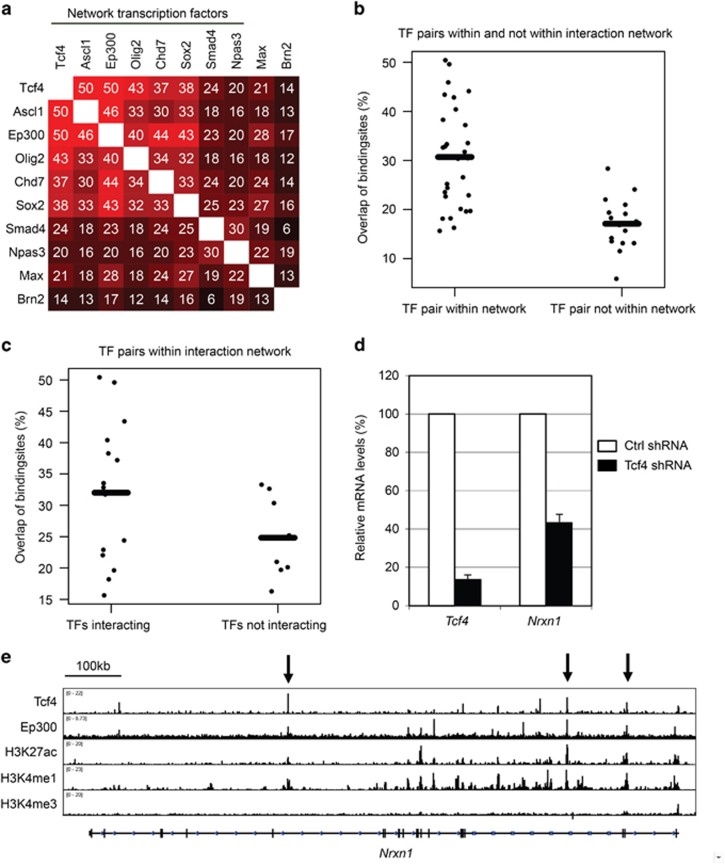
Network transcription factor co-localization on the genome of neural stem cells. (a) Percentage overlap of genome-wide binding sites of pairs of transcription factors (TF pairs). Network transcription factors and percentage overlap of TF pair are indicated. (b) Transcription factors are both in the network (left) or one is in the network and one is not (right). Each TF pair is indicated by a black dot, average overlap in each category is indicated by black bar. (c) Transcription factors are interacting (left) or not interacting (right). Each TF pair is indicated by a black dot, average overlap in each category is indicated by black bar. (d) Relative mRNA levels by RT-PCR of indicated genes in NSCs treated with the indicated shRNAs, s.e.m. of three independent experiments is indicated. (e) Binding site profile of indicated transcription factors and indicated histone modification profiles at Nrxn1. Ep300, H3K4me1 mark enhancers, H3K27ac marks active enhancers, arrows mark transcription factor co-localization. mRNA, messenger RNA; NSC, neural stem cell; shRNA, short hairpin RNA.

