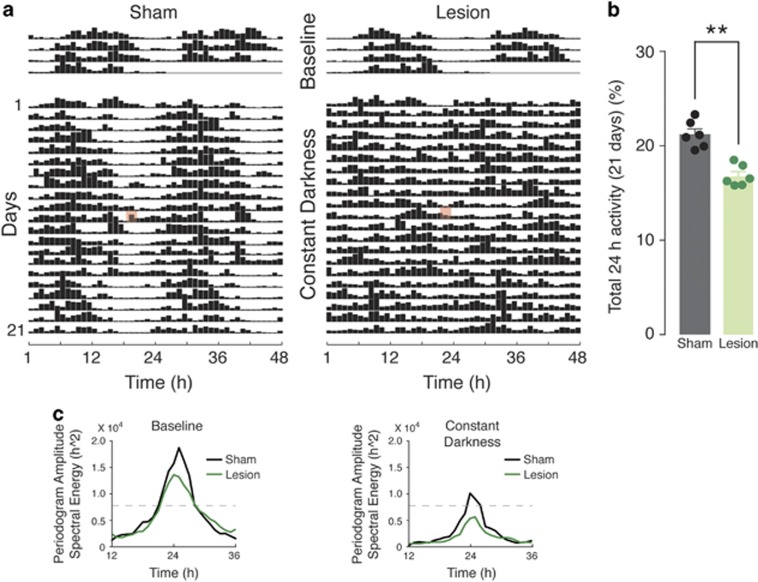
Figure 2.
Analysis of endogenous circadian rhythm in 6-OHDA-lesion mice. (a) Double-plot actograms showing locomotor activity of control (sham-operated) and 6-OHDA-lesion mice, recorded in LD1 (baseline) and constant darkness (DD). Horizontal lines represent successive days and vertical bars indicate averaged time spent on visiting either of the lateral corridors. Red mark indicates a cage change performed during the course of the experiment. Circadian rhythm is maintained in sham-lesion mice, whereas 6-OHDA-lesion mice display evident arrhythmia. (b) Bar graph showing active time during the DD period (21 days). Data represent percentage of active time over total time and are expressed as means±s.e.m. Note that the reduction of active time in the 6-OHDA-lesion group is maintained even in constant darkness; **P<0.01, two-tailed Mann–Whitney test. (c) Periodograms obtained by spectral analysis (Fast Fourier Transformation, FFT) confirming persistence and loss of 24 h rhythmicity in sham and lesion mice, respectively. Peaks above the dashed line (indicating the 95% confidence level) were considered significant circadian periods. 6-OHDA, 6-hydroxydopamine; LD, light/dark.

