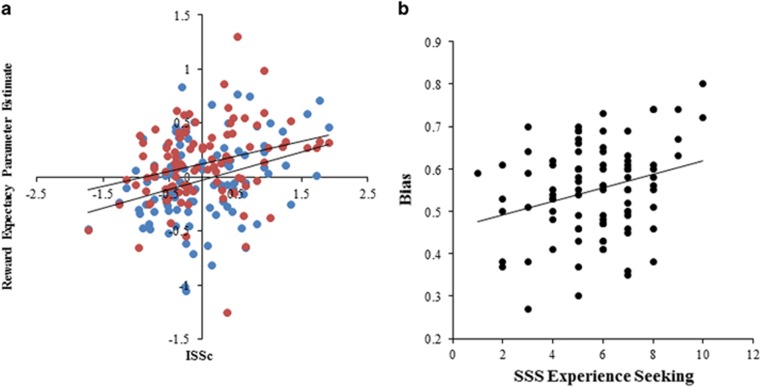
Figure 2.
(a) Associations between ISSc with left vlPFC (blue; r=0.32, P=0.001) and left VS (red; r=0.28, P=0.005). (b) Association between SSS ES and bias score (r=0.29, P=0.006). These figures show relationships without the addition of covariates. The relationships remained significant with the addition of covariates (see Results). ES, experience seeking; ISSc, impulsive sensation seeking subcomponents; SSS, Sensation Seeking Scale; vIPFC, ventrolateral prefrontal cortex; VS, ventral striatum.

