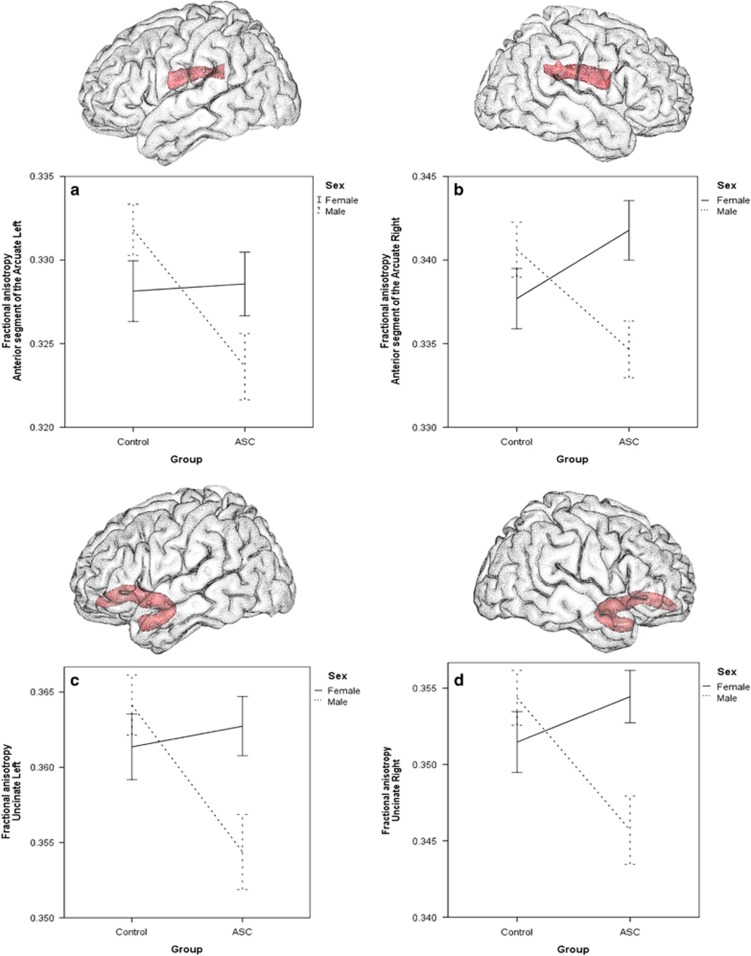
Figure 1.
Visualizations of investigated tracts and mean fractional anisotropy graphs showing significant sex-by-diagnosis interaction effects. (a). Left anterior segment of the AF; (b) right segment of the AF; (c) left UF; (d) right UF. Bars indicate s.e. AF, arcuate fasciculus; ASC, autism spectrum condition; UF, uncinate fasciculus.

