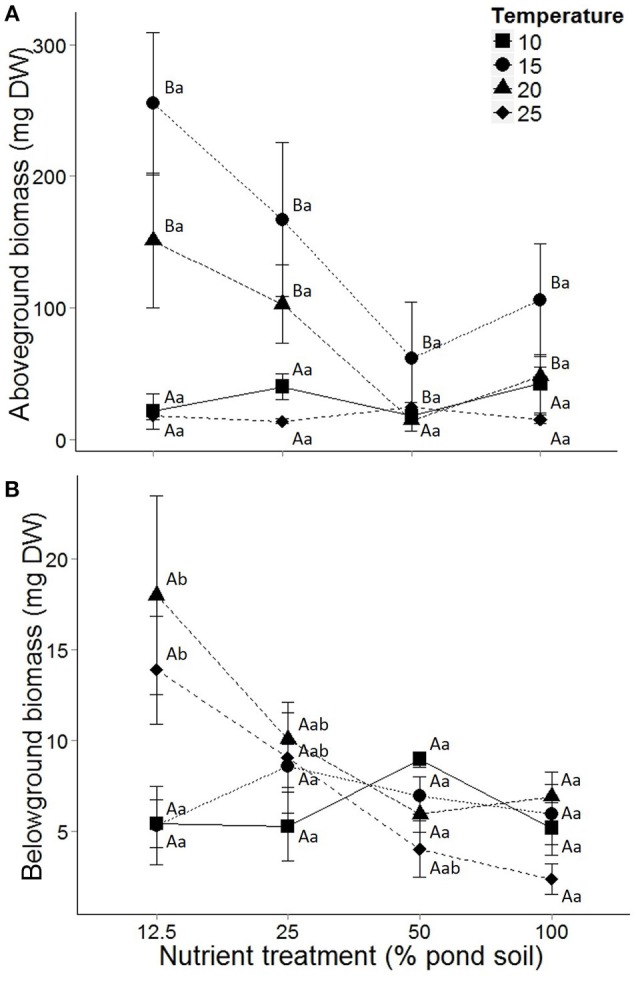
Figure 1.

Above—(A) and belowground (B) biomass of Elodea nuttallii grown at different temperatures and sediment nutrient content. Temperature treatments include 10 (■), 15 (•), 20 (▴) and 25 (♦)°C. Dots represent means and error bars standard error of the mean (n = 5). Capital and lower case letters indicate post-hoc differences between temperature and nutrient treatments, respectively.
