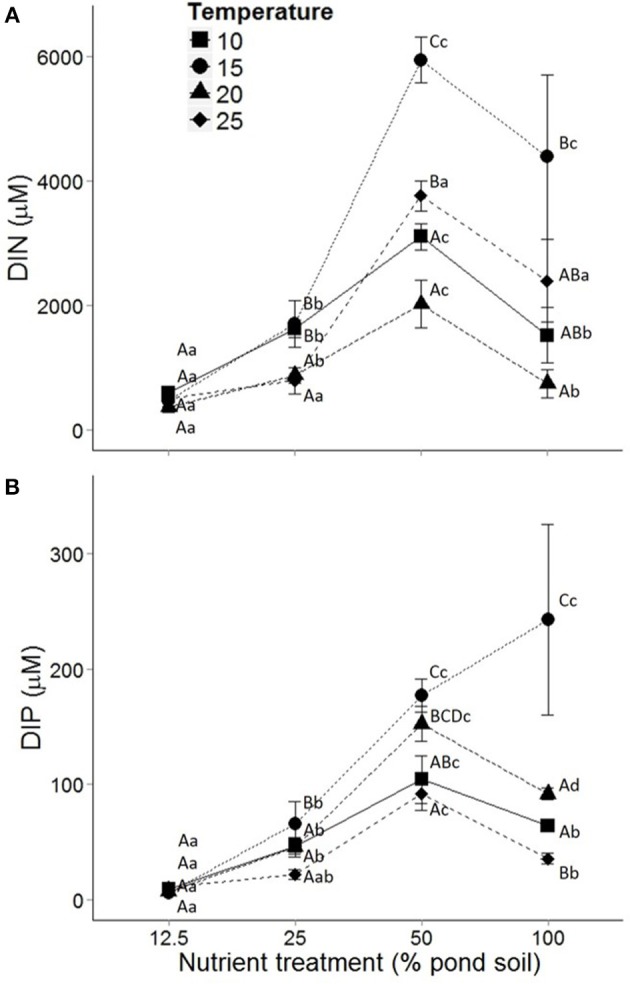
Figure 3.

Dissolved nutrient concentrations in the pore water in response to sediment nutrient content, with dissolved inorganic nitrogen (DIN) (A) and dissolved inorganic phosphorus (DIP) (B) at the end of the experiment. Temperature treatments include 10 (■), 15 (•), 20 (▴) and 25 (♦)°C. Dots represent means and error bars standard error of the mean. Capital and lower case letters indicate post-hoc differences between temperature and nutrient treatments, respectively.
