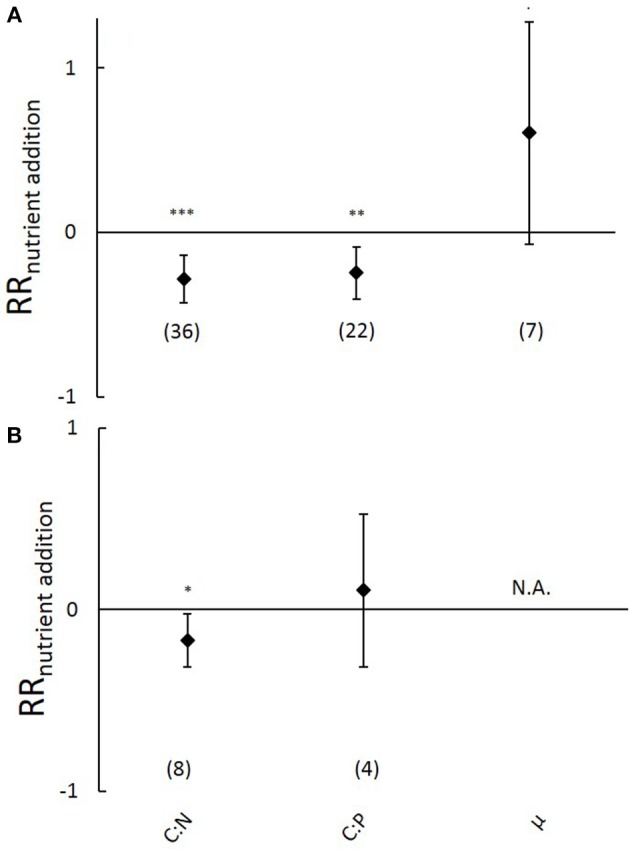
Figure 5.

Natural-log response ratios of carbon:nutrient stoichiometry and plant growth rates (μ) to nutrient (nitrogen and phosphorus) addition in (A) above- and (B) belowground biomass of submerged aquatic plants. Values represent means, error bars 95% confidence intervals and sample size is indicated between brackets. Response ratios significantly different from zero are indicated as follows: ***P < 0.001, **P < 0.01, *P < 0.05 and ·P < 0.10. N.A., indicates that data were not available.
