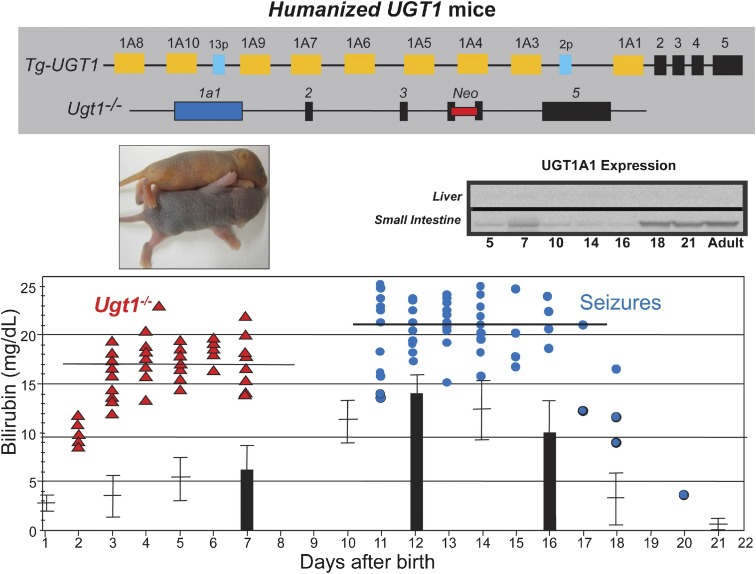
Fig. 2.
The upper panel shows the genetic background of hUGT1A1*28 mice. The top diagram is a representation of the human UGT1A locus, which was inserted into the mouse genome (Tg-UGT1), and the bottom diagram shows the targeted disruption of the mouse Ugt1 locus with an insertion of the neoresistant gene into exon 4. Middle panel (left): The Ugt1−/− neonate exhibits the phenotypic trait of jaundice with a yellow skin color compared with in Ugt1+/− mice. Most of the Ugt1−/− mice die before day 7. Middle panel (right): Expression of UGT1A1 in neonatal liver and small intestine tissues in hUGT1A1*28 mice. The bottom diagram shows comparisons of TSB between the Ugt1−/− and hUGT1A1*28 mice during the developmental period.

