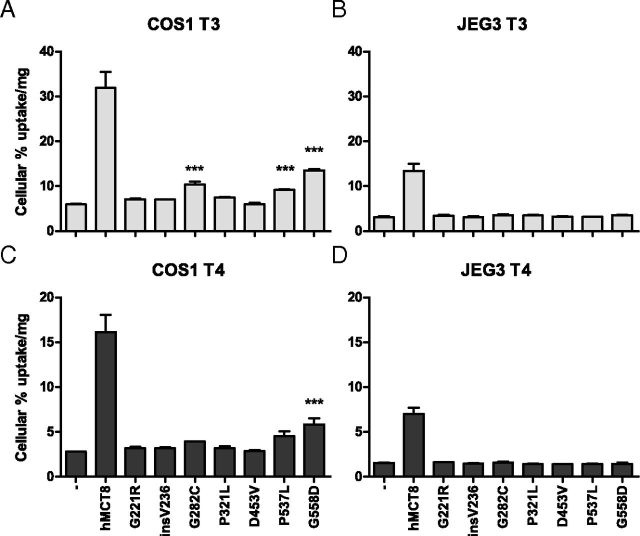
Figure 1.
Uptake of [125I]T3 (A and B) and [125I]T4 (C and D) after 10-minute Incubation in COS1 (A and C) or JEG3 (B and D) Cells Cotransfected with pSG5-CRYM and WT or Mutant pcDNA3-hMCT8. Uptake is shown as percentage of added [125I]T3 or [125I]T4 corrected for protein concentrations. Results are presented as mean ± SEM (n = 3). Significance represents empty vector versus mutant hMCT8. *P < .05; **P < .01; ***P < .001.

