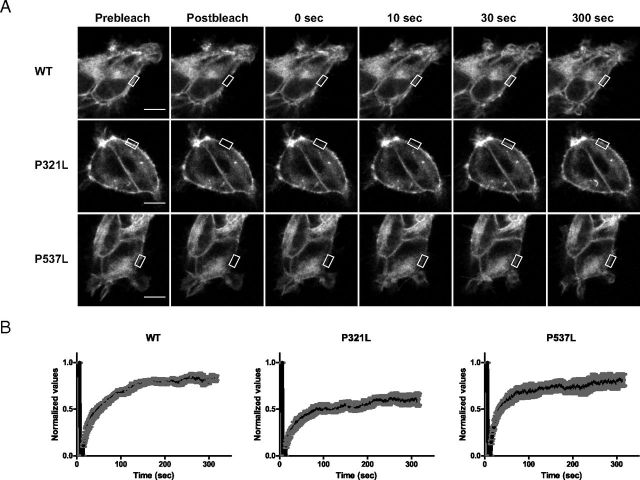
Figure 7.
Live Cell Qualitative FRAP Recovery. A, Images of stably transfected WT-CFP (upper panel), mutant P321L (middle panel), and mutant P537L (lower panel). Images were captured before bleaching (Prebleach), immediately after bleaching (Postbleach), and at increasing points in time to 300 seconds after bleaching. The scale bar corresponds to 10 μm. B, Qualitatively normalized recovery curves of the measured fluorescence of the CFP constructs in panel A that moved into the bleached ROI. Each recovery curve represents mean ± SEM of cells (n = 6) produced from the raw data. A Gaussian blur was applied to the images, and contrast was enhanced to optimize visualization.

