Figure 2.
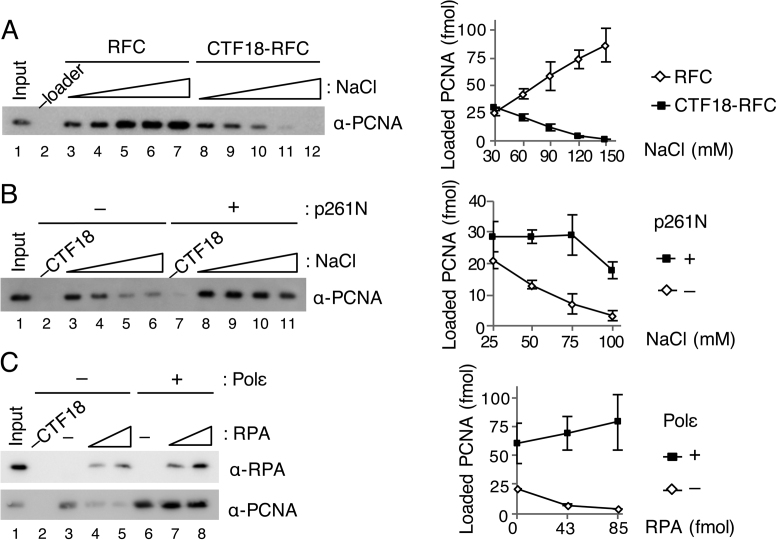
Effect of salt concentrations and RPA on PCNA loading by CTF18-RFC. (A) Titration of NaCl concentration from 30 mM to 150 mM for PCNA loading by 50 fmol each of RFC (lanes 3–7) or CTF18-RFC (lanes 8–12). PCNA in 50% bound fractions (lanes 2–12) and input control (12 fmol) were detected by immunoblotting (left). The band intensities were quantified and graphed with mean ± S.E. of two experimental replicates (right). (B) Titration of NaCl (25–100 mM) for PCNA loading by 30 fmol of CTF18-RFC with (lanes 7–11) or without (lanes 2–6) 200 fmol of p261N. PCNA in 50% bound fractions (lanes 2–11) and input control (12 fmol) were detected by immunoblotting (left), and their band intensities were quantified and graphed with mean ± S.E. of two experimental replicates (right). (C) Effects of RPA (42, 85 fmol) on PCNA loading with 30 ng gapped-DNA beads at 60 mM NaCl using 100 fmol CTF18-RFC with (lanes 6–8) or without (lanes 3–5) 200 fmol Polε. The total bound fractions (lanes 2–8) and 42 fmol RPA and 12 fmol PCNA as the input control (lane 1) were analysed by immunoblotting with the indicated antibodies (left). Band intensities of PCNA were quantified and graphed with the mean ± S.E. of three experimental replicates (right).

