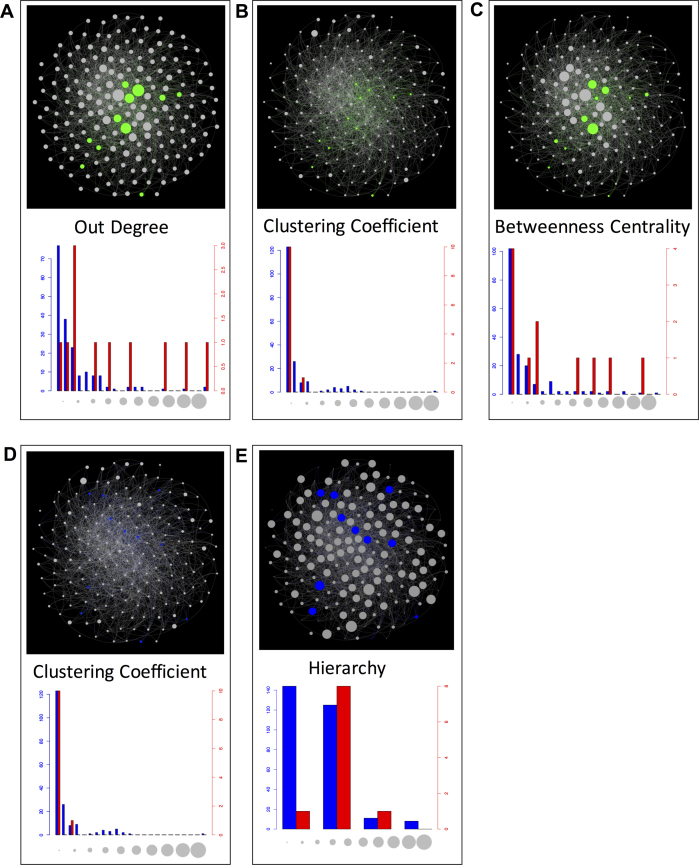
Figure 4.
Network analysis and highlighted network topology for groups of different library components. Rewired genes identified in library screens are shown in the context of their endogenous roles—natural and non-modified. Each figure section contains a network diagram (top) and a histogram (bottom). For library CDSs (A), (B) and (C) show out degree, clustering coefficient and betweenness centrality respectively. For promoters (D) and (E) show clustering coefficient and hierarchy respectively. In the network diagram nodes represent a gene and an edge represents a transcription factor binding to the promoter of a target gene. Colored nodes represent library hits, green for CDSs and blue for promoters. Grey nodes represent the remaining transcription factor comparison set. Only transcription factors are shown in the diagram and compared in the analysis. The size of a node positively correlates to the topological property being quantified. In the histograms blue bars represent the background transcription factor set for the network topology property being measured (gray nodes) and the red bars the library set of interest (green or blue nodes).

