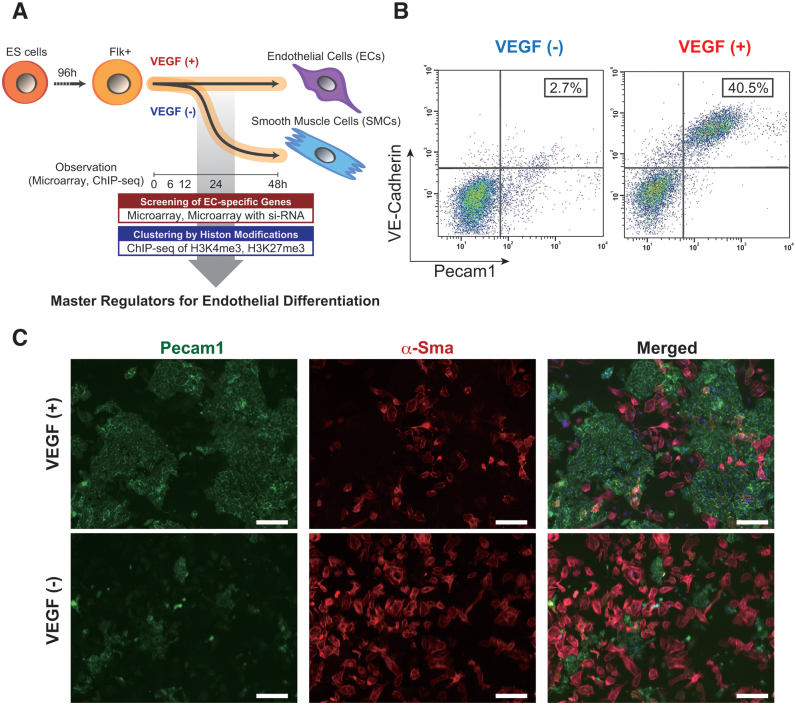
Figure 1.
In vitro EC differentiation system from ES cells. (A) Schematic view of the strategy to comprehensive data analysis with dynamic EC differentiation. (B) Flow cytometry data representation. X and Y-axis indicate Pecam1 and VE-cadherin positive cell counts, respectively. The rate of both Pecam1 and VE-cadherin positive ECs derived from total Flk-1 cell-derived cells were indicated into the panel (%). Cells were treated in the absence (left) or presence (right panel) of 50 ng/ml VEGF. (C) Immuno-staining data with antibodies to Pecam1 (green, left) and α-SMA (red, middle panel). Merged images were shown in right. Cells were treated with (upper) or without 50 ng/ml VEGF (lower panel). Scale bar: 50 μm.

