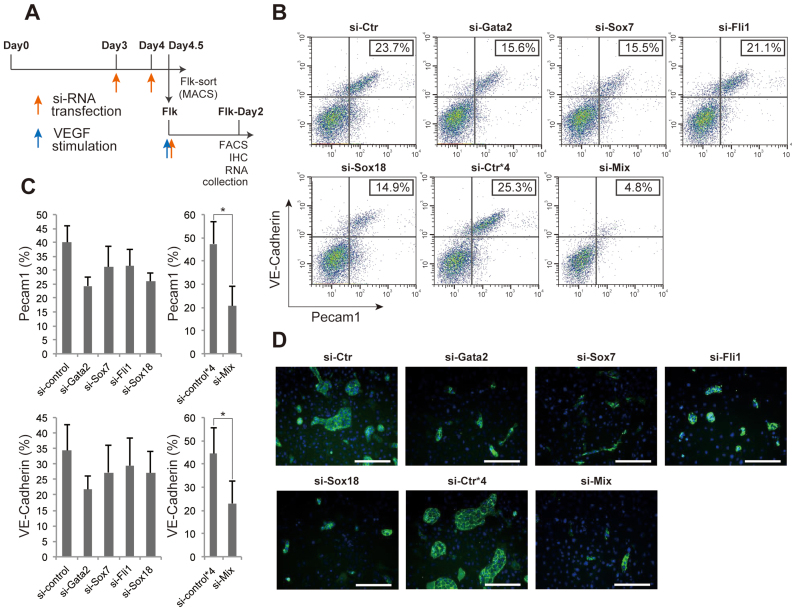
Figure 5.
Functional validation of the master transcription factor for EC differentiation. (A) Time points for siRNA transfection during EC differentiation. During the first 4.5 days of cells culture, siRNA was twice transfected at the days 3 and 4, and then sorted Flk-1 positive cells were subjected to siRNA transfection, again. Red and blue arrows represent the timing of siRNA transfection and VEGF stimulation, respectively. (B) Flow cytometry data representation. X and Y-axis indicate Pecam1 and VE-cadherin positive cell counts, respectively. The rate of both Pecam1 and VE-cadherin positive ECs derived from total Flk-1 cell-derived cells were indicated into the panel (%). (C) Quantitative evaluation of the effect of each or combined siRNA transfection. The results show the mean and standard deviations of Pecam1 (upper) or VE-cadherin (lower) positive EC induction rate (%) from Flk-1 cells by FACS, obtained triplicate. n = 3; *P < 0.05 versus si-control. (D) Immuno-staining data with antibody to Pecam1 (green) and DAPI (blue). Si-Ctr*4 indicates that 4-fold higher amount of si-control was added to the cells compared to si-Ctr. Si-Mix means that si-Gata2, si-Sox7, si-Fli1 and si-Sox18 were added to the cells. Scale bar: 50 μm.

