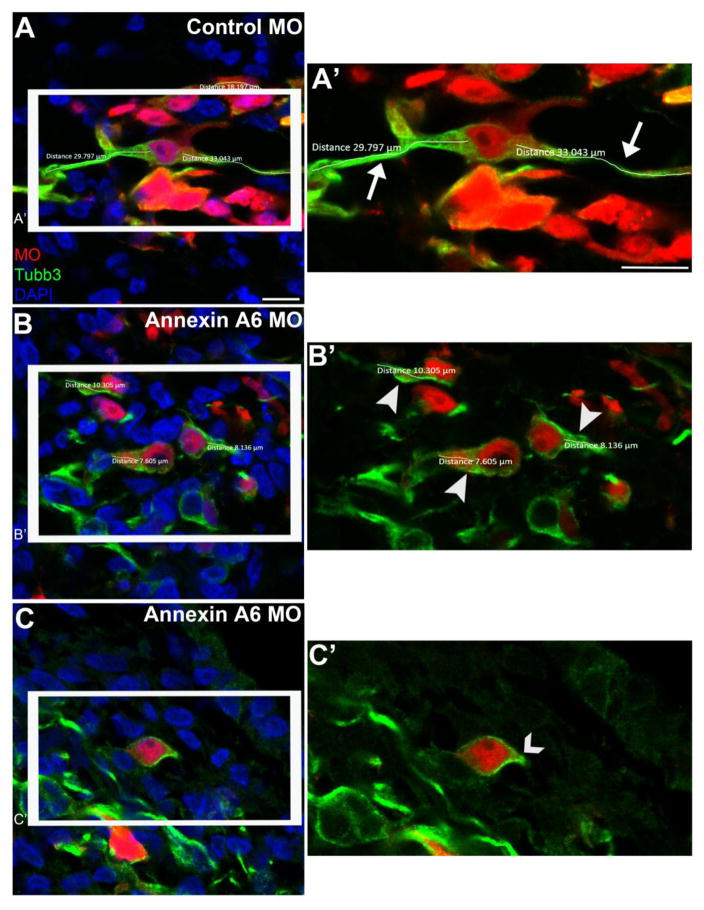
Figure 4. Annexin A6-depleted neurons possess few to no neuronal processes.
Representative confocal images of trigeminal neurons containing a 5 bp mismatch control Annexin A6 (A, A’) or Annexin A6 (B-C’) MO at HH16. Trigeminal neurons electroporated with the control MO show bipolar projections, as seen by Tubb3 immunostaining (A), which were measured in their entirety (A’, arrows), while those possessing Annexin A6 MO show few (B, B’, arrowheads) to no (C, C’, caret) processes. DAPI (blue) labels cell nuclei. Scale bar, 25 μm (A-C) and 12.5 μm (A’, B’, C’).

