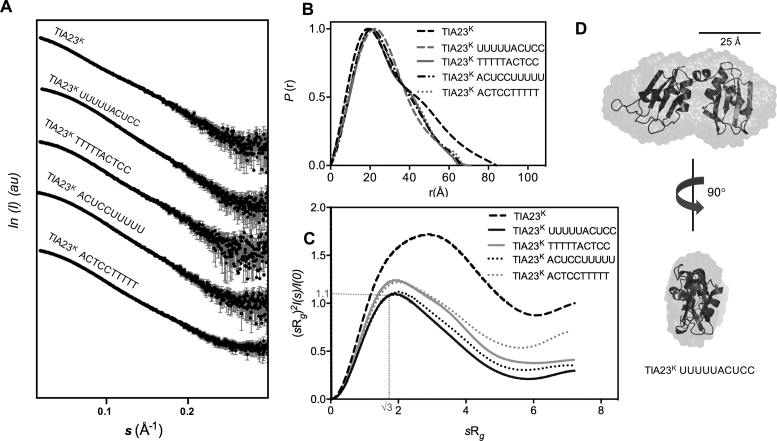
Figure 3.
SAXS analysis of apo-TIA-1 RRM23K, TIA-1 RRM23K/RNA and TIA-1 RRM23K/DNA complexes. (A) The scattering intensity (I) is plotted in arbitrary units (au) versus the forward scattering vector (s) in the units of inverse Å for TIA-1 RRM23K (abbreviated TIA23K) before and after being combined with RNA and DNA sequences (sequences as indicated). The error bars in gray indicate the mean ± SD. (B) P(r) profiles calculated from the scattering data are plotted against r in the units of Å. (C) Normalized Kratky Plots for TIA-1 RRM23K calculated from the scattering data are shown across units of sRg. (D) Ab initio shape reconstruction determined for the TIA-1RRM23K /UUUUUACUCC complex using DAMMIF (NSD = 0.66 ± 0.04) (31). Superposed are ribbon representations of TIA-1 RRM2 and RRM3 derived from the NMR structure PDB ID: 2MJN to show the relative scale of the ab initio shape.

