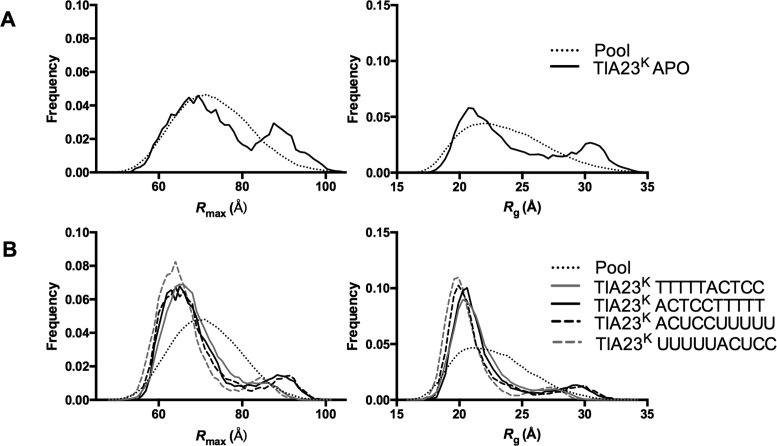
Figure 4.
Ensemble optimization analysis of apo-TIA-1 RRM23K, TIA-1 RRM23K/RNA and TIA-1 RRM23K/DNA complexes. Rmax and Rg distributions from the best fitting ensembles were calculated using ensemble optimization method (42). (A) The distribution of the pool of 10 000 models (dotted line) and the selected best fitting ensemble (solid line) are shown for apo-TIA-1 RRM23K (abbreviated TIA23K APO). (B) The distribution of the pool of 10 000 models (dotted line) and the selected best fitting ensemble are shown for TIA-1 RRM23K complexes with RNA and DNA sequences (as indicated in the key).

