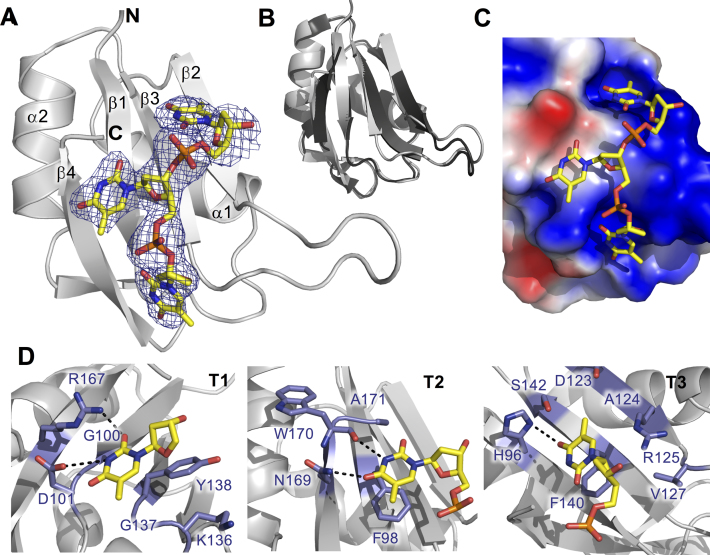
Figure 5.
Structure of TIA-1 RRM2/TTT complex (PDB ID: 5ITH) (A) Cartoon representation of the solved TIA-1 RRM2 structure with electron density map indicating the position of the bound oligonucleotide. DNA is shown as sticks, colored by atom type. N-and C-termini as well as secondary structural elements of the protein are labeled. (B) Superposition of the oligonucleotide-bound form of TIA-1 RRM2 (gray) with the apo-structure previously reported (PDB ID: 3BS9). (C) Electrostatic surface contour representation, showing thymine binding pockets across the surface of TIA-1 RRM2 and the oligonucleotide in stick representation. The surface was generated using the Adaptive Poisson-Boltzmann Solver software package (http://www.poissonboltzmann.org). Positive and negative potentials are colored blue and red, respectively. (D) Detail of TIA-1 RRM2 sidechain interactions with thymine in the three oligonucleotide binding sites. Hydrogen bond interactions are highlighted with hashed lines.

