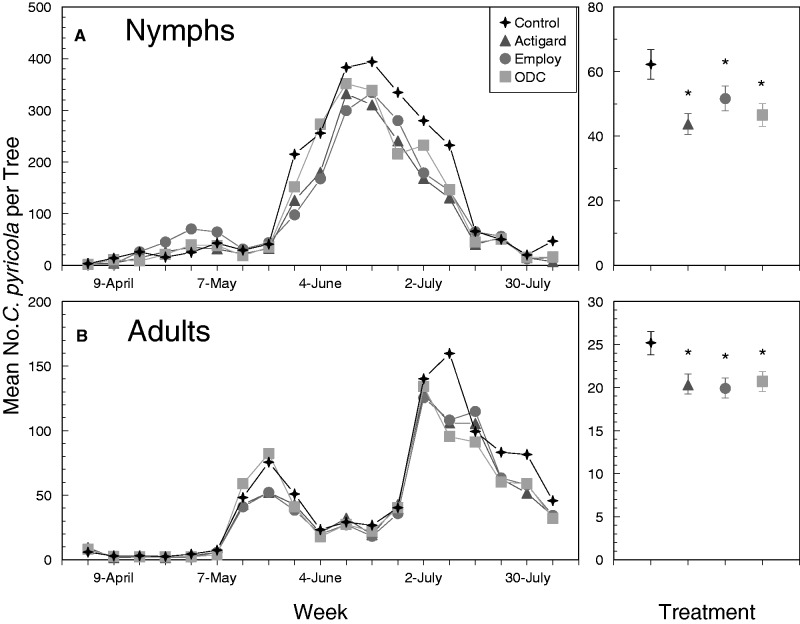
Fig. 1.
Mean number of C. pyricola nymphs per shoot (A) and adults per beat sheet sample (B) in 2014. Dates provided on the x-axis indicate days on which foliar applications were applied. Figures on the right show the overall effects of treatment regardless of sampling week. Error bars denote SEs and an asterisks indicate that values are significantly different from the untreated control treatment.

