Figure 1.
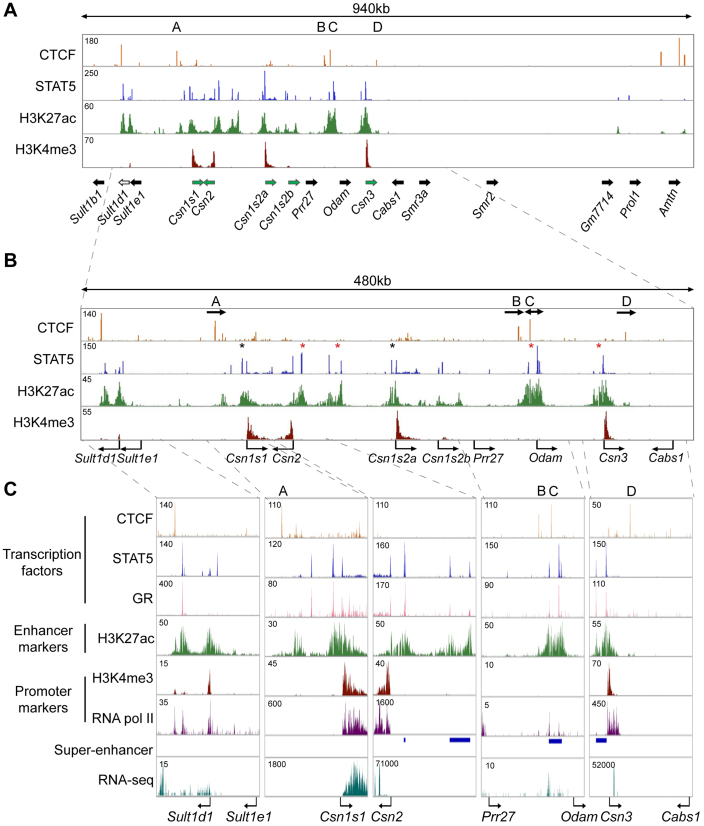
Genomic features of the Csn locus during lactation. (A–C) ChIP-seq data for CTCF, STAT5, H3K27ac and H3K4me3 provided structural information on the locus (upper panel). The orientation of genes (panel A) is indicated by solid arrows. Green arrows, genes highly expressed in mammary tissue; black arrows, genes not expressed, or at very low levels, in mammary tissue; white arrow, Sult1d1, which is expressed at low levels in mammary tissue and induced upon deletion of CTCF site A. Four STAT5-based super-enhancers (red asterisks in the panel B and blue bars in panel C) and two solitary enhancers (black asterisks in the panel B) were identified. The presence of Pol II and total RNA transcripts was associated with transcriptional units and enhancers (panel C). Arrows in panel B indicate the orientations of CTCF binding sites.

