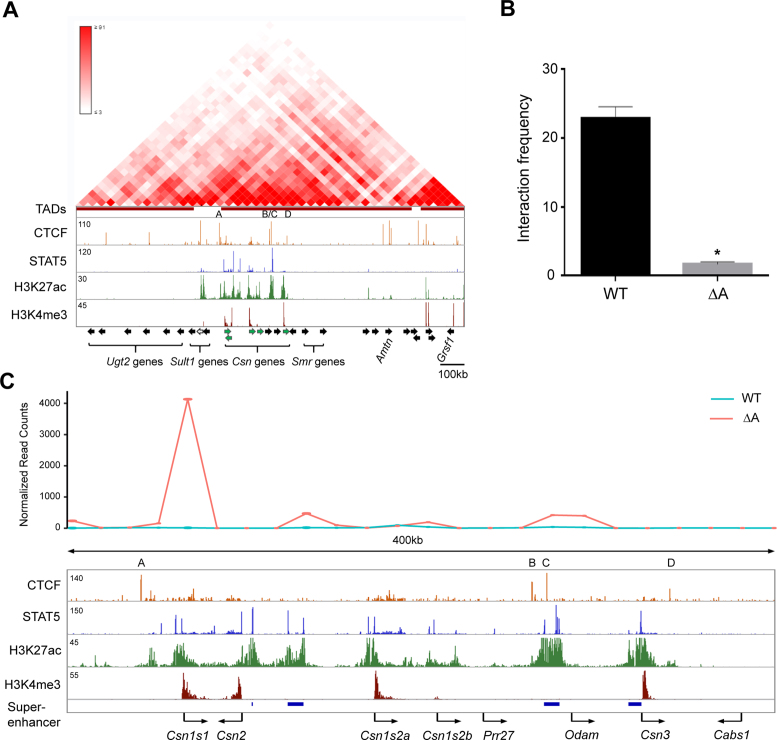
Figure 5.
Interactions between individual CTCF sites within the casein locus (A, B) and between the Sult1d1 promoter and casein enhancers. (A) Hi-C data from mESC (46,47) define TADs and ChIP-seq data from mammary gland in the casein locus. (B) Interactions between CTCF sites A and site C were detected by 3C in WT mammary tissue and greatly reduced upon deletion of CTCF site A. Results are shown as means ± S.E.M. of independent biological replicates (WT and A, n = 3). A two-tailed unpaired t test was used to evaluate the statistical significance of differences between WT and A mutant: *P < 0.05. (C) The Sult1d1 promoter, as anchor, interacted with several Csn enhancers as determined by 4C in mammary tissue lacking CTCF site A.

