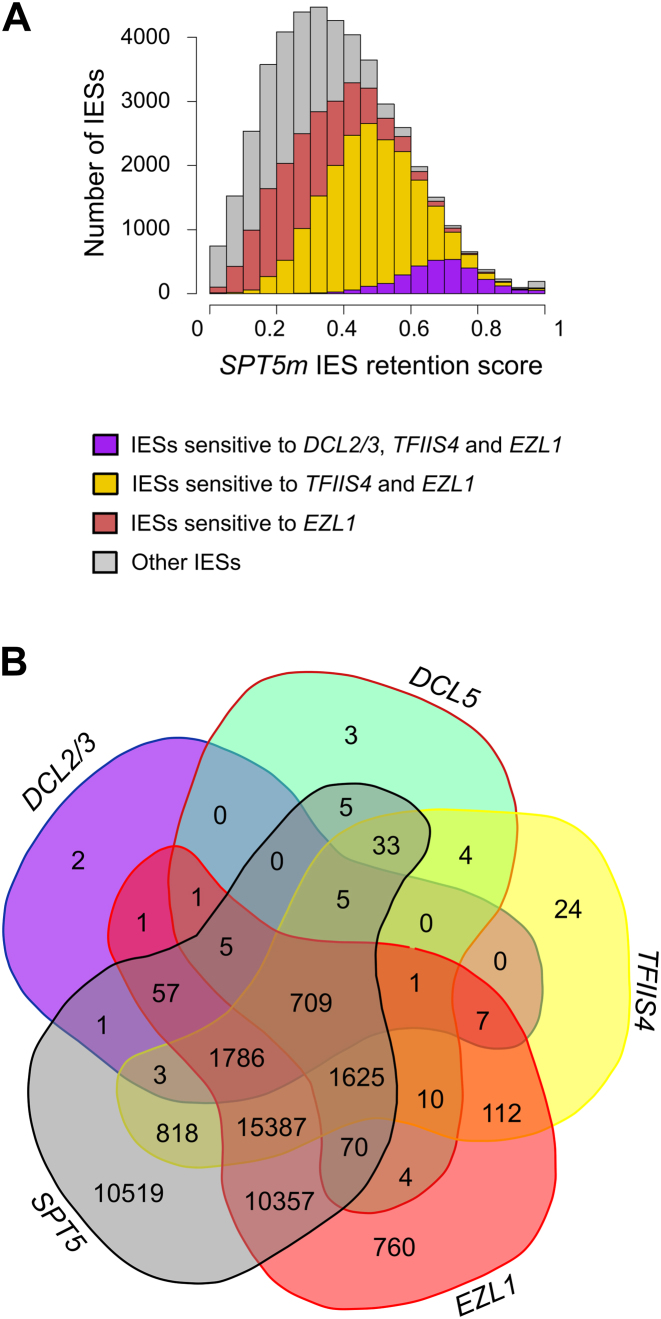
Figure 4.
Analysis of IES excision in SPT5m-silenced cells. (A) Retention score distribution determined by re-sequencing DNA extracted from a cell fraction enriched in new MACs, after SPT5m silencing. IESs with a given SPT5m retention score that are sensitive to DCL2/3, TFIIS4 or EZL1 as determined using published data (34,37,38) are indicated. Bar coloring: purple, DCL2/3 + TFIIS + EZL1; yellow, TFIIS4 + EZL1; red, EZL1. (B) Venn diagram showing significantly retained IESs after SPT5m, EZL1, TFIIS4, DCL2/3 or DCL5 silencing. Details can be found in Supplementary Table S4.

