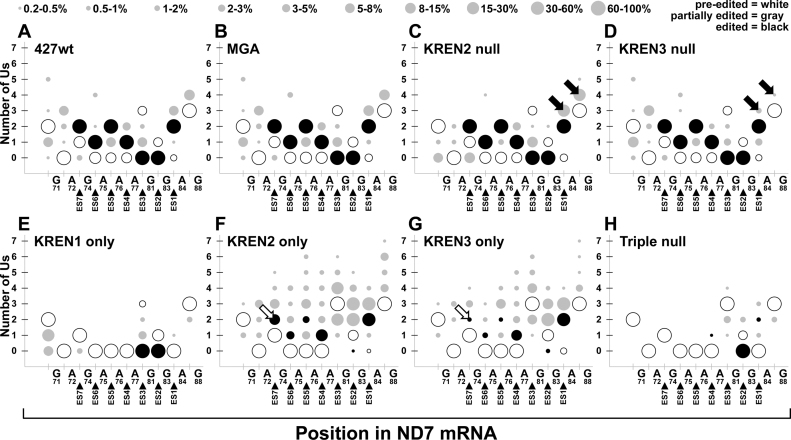
Figure 8.
Bubble plot analyses of ND7-5΄ edited read sequences show the frequency of site-specific insertion and deletion activities. Bubble plots of ND7-5΄ editing for each cell line displayed as described for Figure 8. Open arrows highlight differences in fully edited ES7 corresponding to differences in KREN2 and KREN3 activities. Closed arrows highlight predominant non-canonical insertions before and at ES1 that reflect differences in KREN2 and KREN3 activities.

