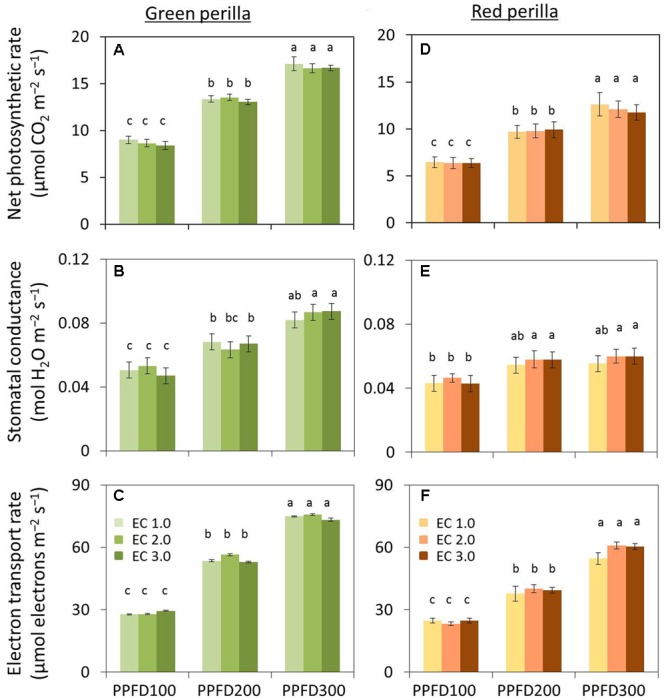
FIGURE 3.

Effects of different PPFD and EC treatments on net photosynthetic rate (A), stomatal conductance (B), and electron transport rate (ETR) (C) in green perilla, and net photosynthetic rate (D), stomatal conductance (E), and ETR (F) in red perilla plants 4 weeks after transplant. PPFD was 100, 200, and 300 μmol m-2s-1. Leaf temperature and CO2 concentration were 23 ± 1°C and 1,000 ± 5 μL L-1, respectively. Values are mean ± standard error (n = 10–12). Different letters indicate significant differences between treatments at P < 0.05, as determined by Tukey’s test.
