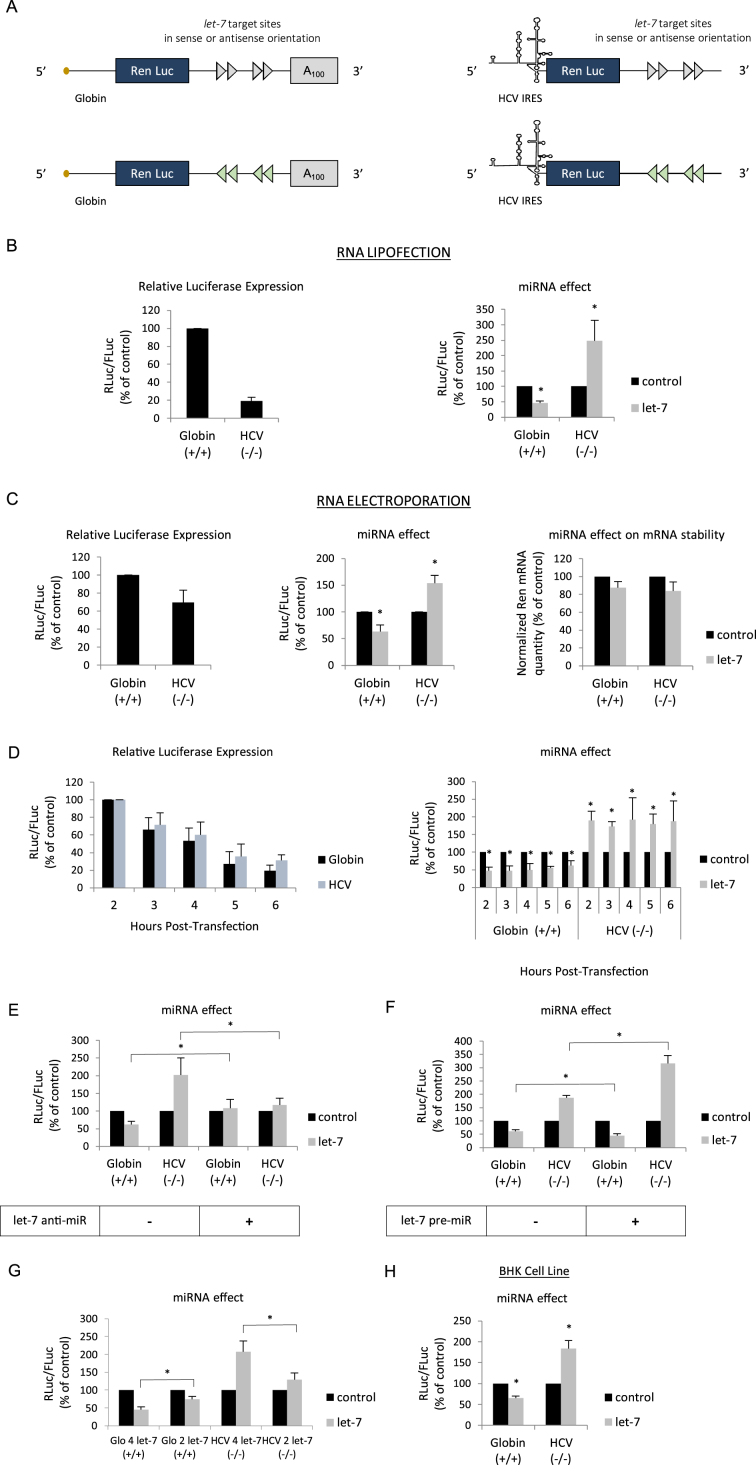
Figure 1.
(A) Schematic representation of the reporter microRNAs (mRNAs) used in this study. The mRNAs were obtained by in vitro transcription and harbor the Renilla luciferase coding region which is driven by either the globin 5΄ UTR or the HCV IRES as indicated. The 3΄ UTR contains 4 let-7 target sites in a sense (blue arrows) or antisense orientation (red arrows) and is terminated, or not, by a stretch of 100 adenine residues (A100). (B) Capped/polyadenylated (+/+) and uncapped/non polyadenylated (-/-) Renilla luciferase mRNAs driven by the β-globin 5΄ UTR and the HCV IRES respectively were transfected together with a control Firefly luciferase mRNA in HeLa cells by lipofection (see Materials and Methods). Luciferase assays were performed 150 min post transfection. Left panel shows the relative Luciferase expression level (ratio RLuc/FLuc) for the constructs that bear the let-7 target sites in the antisense orientation (no miRNA effect). Right panel shows the miRNA effect which is given by the difference of expression from constructs containing the let-7 sites in the antisense orientation (black bars) with those in the sense orientation (grey bars). Results are expressed as a percentage of the control (construct bearing the let-7 sites in the antisense orientation (black bars), set to 100%). (C) The same constructs as above were electroporated together with a control Firefly luciferase mRNA in HeLa cells and luciferase activities were measured after 1 h. Left panel shows the relative Luciferase expression level (ratio RLuc/FLuc) for the constructs that bear the let-7 target sites in the antisense orientation. Middle panel shows the miRNA effect which is given by the difference of expression from constructs containing the let-7 sites in the antisense orientation (black bars) with those in the sense orientation (grey bars). Right panel shows the quantification of cytoplasmic Renilla luciferase mRNAs by quantitative RT-PCR. Results are normalized to an internal endogenous mRNA (GAPDH) and are expressed as a percentage of the control (construct containing the let-7 sites in the antisense orientation (black bars), set to 100%). (D) Hepatitis C virus (HCV) (black bars) and β-globin 5΄ UTRs (blue bars) driven mRNA constructs were lipofected in HeLa cells and luciferase activities were determined at 2, 3, 4, 5 and 6 h post transfection. Left panel shows the relative luciferase expression level (ratio RLuc/FLuc) for the constructs that bear the let-7 target sites in the antisense orientation. Right panel shows the miRNA effect that is given by the difference of expression from constructs containing the let-7 sites in the antisense orientation (black bars) with those in the sense orientation (grey bars). (E) mRNA constructs described above were lipofected with an anti-miR control or an anti-miR specific to let-7 before determination of luciferase activities. The graph shows the miRNA effect that is given by the difference of expression from constructs containing the let-7 sites in the antisense orientation (black bars) with those in the sense orientation (grey bars). (F) mRNA constructs described above were lipofected with a pre-miR control or a let-7 pre-miR one day before determination of luciferase activities. The graph shows the miRNA effect which is given by the difference of expression from constructs containing the let-7 sites in the antisense orientation (black bars) with those in the sense orientation (grey bars). (G) Capped/polyadenylated (+/+) driven by the β-globin 5΄ UTR and containing either 2 or 4 let-7 sites in their 3΄ UTRs were electroporated with uncapped/non polyadenylated (-/-) Renilla luciferase mRNAs driven by HCV IRES and containing either 2 or 4 let-7 sites in their 3΄ UTRs. A control Firefly luciferase mRNA was also electroporated in HeLa cells and luciferase activities were measured after 1 h. Data were plotted and normalized as a percentage of the control (constructs with the 2 or 4 let-7 sites in the antisense orientation) that was set to 100%. (E) mRNA constructs described above were lipofected in BHK cell line in a similar experimental design than described in (B). The graph shows the miRNA effect which is given by the difference of expression from constructs containing the let-7 sites in the antisense orientation (black bars) with those in the sense orientation (grey bars). Error bars correspond to SD obtained from, at least, three different experiments. * corresponds to P-value < 0.05 obtained with a non-parametric Wilcoxon–Mann–Withney test.

