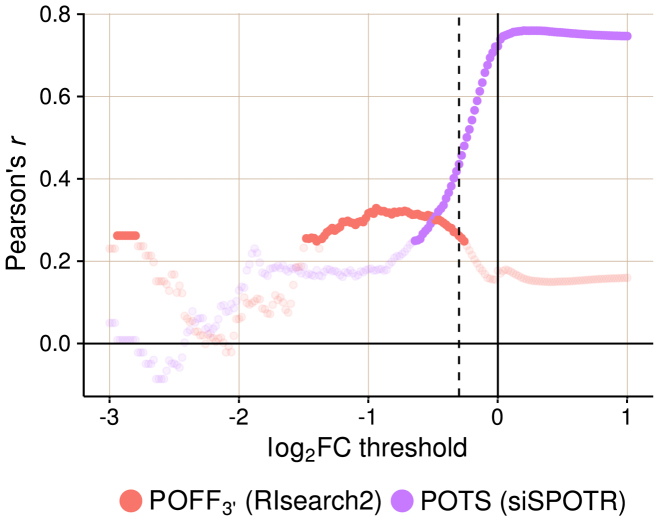
Figure 4.
Evaluation of predicted off-targeting potential measures with siRNA-specific differential expression data from 63 siRNA transfection experiments. Pearson's r is given for each correlation analysis between method-specific off-targeting potential measure, RIsearch2-based  or siSPOTR-based
  , and threshold-specific expression-based off-targeting potential measure of 63 siRNAs. The expression-based measure corresponds to the number of transcripts that have a complementary heptamer to the siRNA seed region in their 3΄ UTR and are differentially expressed upon siRNA transfection with a log2FC value lower than the threshold given on the x-axis. Only significant correlations (P-value < 0.05) are highlighted and the log2FC threshold −0.3, which is the evaluation threshold employed in the siSPOTR study, is shown with a dashed line.

