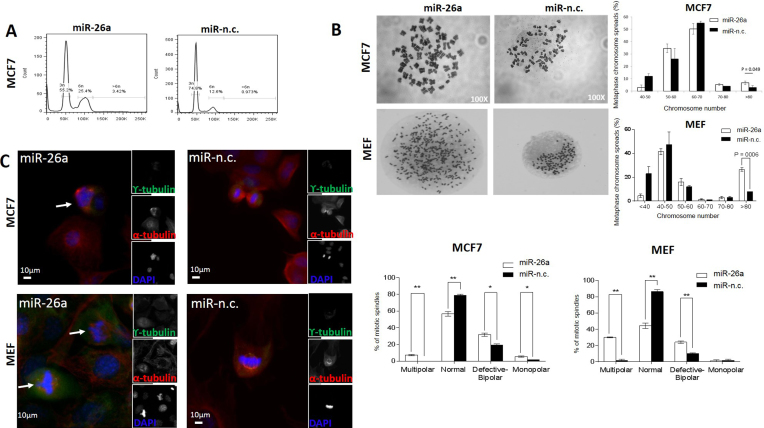
Figure 2.
MiR-26a affects cellular DNA content and causes mitotic defects in MCF-7 as well as MEF cells. (A) MCF-7 cells transfected with the indicated miRNA precursors (5 nM) for 9 days were stained with PI for flow cytometry analysis of DNA content. Data are representative of three independent experiments. (B) Representative metaphase chromosome spreads of MCF-7 and MEF cells transfected for 9 days with the indicated miRNA precursors. Magnification: 100×. Percentages of metaphase chromosome spreads containing the indicated ranges of chromosome number. Chromosome number of 100 methaphase spreads was determined per conditions. Data are mean of three independent experiments (P = 0.04, Student's t-test). (C) Cells were transfected with the indicated miRNA precursors (5 nM) for 9 days, synchronized with nocodazole and then released for 1 h to increase mitotic feature observation. Co-immunostaining was performed with γ- and α-tubulin antibodies and chromosomes were stained with DAPI (individual stain is visualized in reduced, gray scale images). Cells were visualized with EVOS® FL Cell imaging system (Life technologies). Scale bar: 10 μm. Arrows show centrosome amplification. The graph on the right shows percentage of mitotic spindle types (multipolar, normal, defective bipolar and monopolar spindles) observed. 80–100 mitotic cells were counted per condition. Data are mean of three independent experiments ± S.E.M. (*P < 0.01, **P ≤ 0.001, ***P ≤ 0.0001, Two-way ANOVA test).

