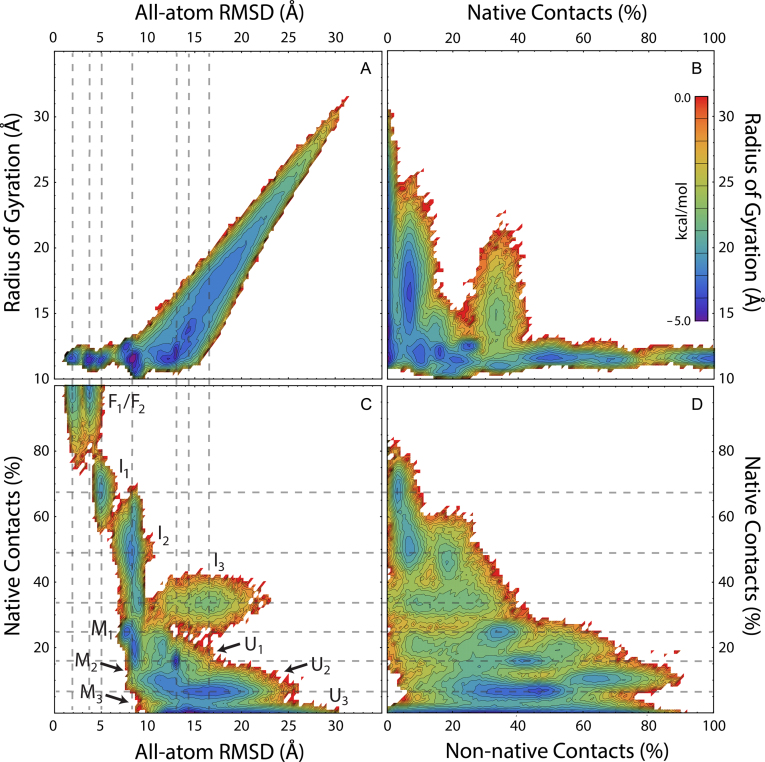
Figure 4.
Free energy surface projected onto the RMSD, Rg and percentage of native and non-native contact folding metrics. State labels in (C) indicate observed macrostates participating in the equilibrium folding mechanism. Dashed lines are provided to visually align a given state depicted in neighboring projections. The color-coded energy scale shown in (B) applies to all panels shown.

