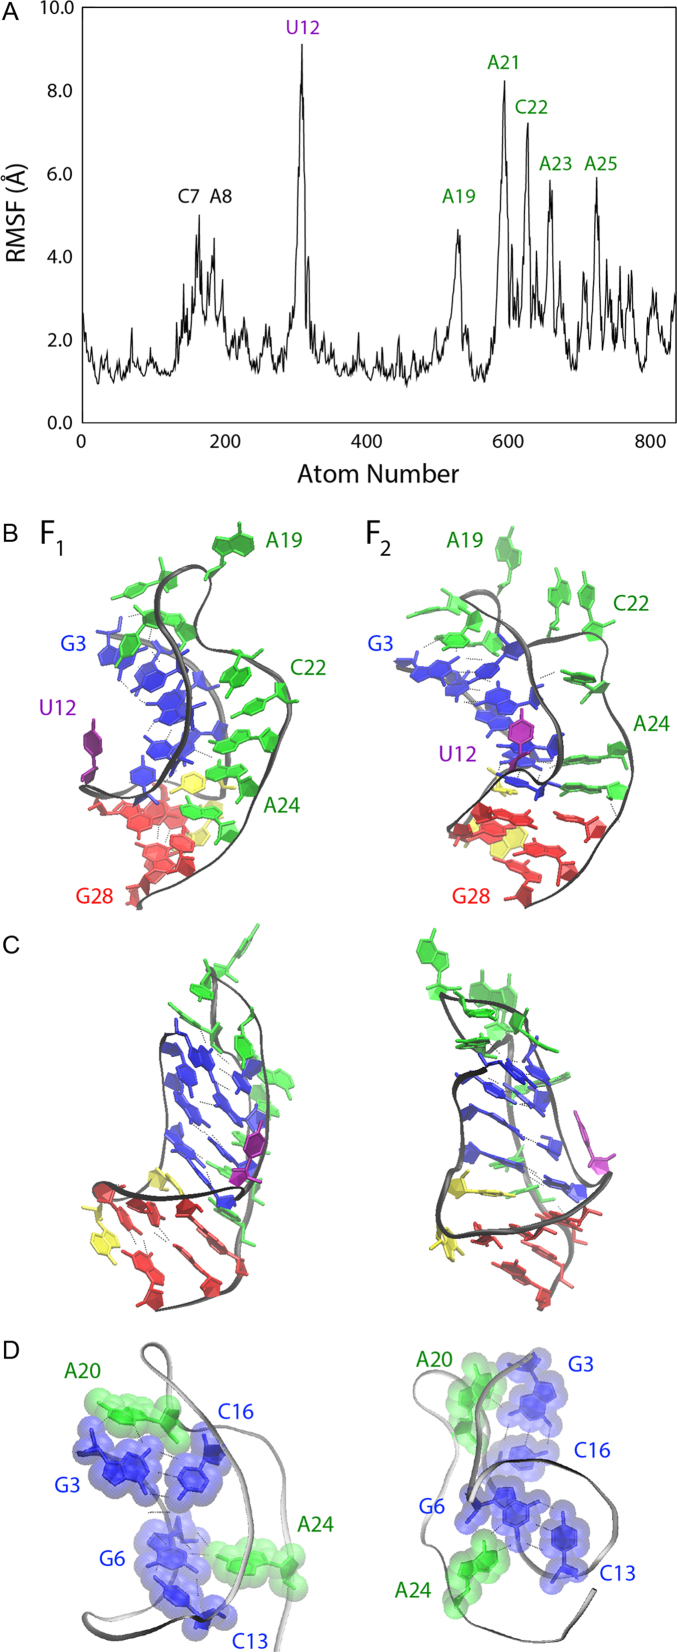
Figure 5.
(A) The root-mean-squared fluctuation observed in our native state simulated ensemble, with residue labels denoting regions that show larger fluctuations than the baseline of ∼2 Å. (B) Ensemble average structures of the PLRV pseudoknot native states, F1 (left) and F2 (right), with specific residues labeled and substructures colored for visual clarity, including Stem 1 (blue), Loop 1 (yellow), Stem 2 (red) and Loop 2 (green). (C) Native structures in (B) rotated 90° about the vertical axis for visual inspection. (D) Native structures shown in (A) and (B) oriented and presented to emphasize interactions of the relatively immobile A20 and A24 residues with Stem 1 base-pairs; hydrogen bonds are represented as dotted lines and transparent molecular surfaces are provided to visualize van der Waals contacts.

